REM Sleep Behaviour Disorder Dominates Heterogeneity in Longitudinal Analysis of Parkinson's Disease
Abstract
Parkinson’s disease (PD) exhibits significant clinical heterogeneity, yet the longitudinal interplay between multidomain symptoms and structural biomarkers remains underexplored. We analyzed 5-year data from the PPMI cohort (N=855) using multivariate latent class mixed modeling (multlcmm) to identify distinct progression phenotypes. A two-step externVar approach assessed class predictors, while Linear Mixed Models and XGBoost characterized longitudinal atrophy and early-stage subtype prediction. Three classes emerged: Stable High-Burden (Class 1, n=173), Low-Burden (Class 2, n=568), and Increasing-Burden (Class 3, n=114). Model assignment was primarily driven by RBDSQ trajectories (ARI = 0.96) and validated by significantly lower baseline UPSIT scores in Classes 1 and 3 ( < .01). Class 1 exhibited pronounced baseline atrophy, whereas Class 3 demonstrated accelerated longitudinal structural change. SHAP analysis identified baseline RBDSQ as the most critical predictor of class membership.
Introduction
Translational research mandates from the National Institutes of Health emphasize the urgent need to characterize the natural history of Parkinson’s disease (PD) and develop objective stratification tools Sieber et al., 2014. Large-scale cohort studies, such as the Parkinson’s Precision Medicine Initiative (PPMI), now provide the infrastructure to discover data-driven progression subtypes and accelerate targeted therapeutic trials Marek et al., 2018. Historically, stratification relied on baseline motor features such as tremor-dominant and PIGD phenotypes Jankovic et al., 1990. However, both clinical and data-driven subtypes are predominantly early-stage phenomena, often coalescing into a more uniform clinical presentation as the disease advances Sauerbier et al., 2016.
Comprehensive multidomain clustering studies have significantly advanced our understanding of PD heterogeneity. By defining phenotypic profiles at a static baseline, standard distance-based clustering approaches have successfully identified subgroups with distinctly divergent clinical outcomes, such as the fast-progressing “diffuse malignant” phenotype Fereshtehnejad et al., 2015Fereshtehnejad et al., 2017Velucci et al., 2025. Notably, this same temporal approach is frequently mirrored even in studies utilizing advanced machine learning frameworks Markello et al., 2021: phenotypic classes are established cross-sectionally, and longitudinal follow-up is only used post hoc to observe the progression of these fixed groups. Conversely, approaches that explicitly subtype patients based on progression rates have demonstrated the immense prognostic value of temporal data Faghri et al., 2018. Yet, these machine learning methods often compress longitudinal follow-up into static summary vectors, obscuring the dynamic shape of the disease course.
To capture actual symptom evolution, univariate latent class models have mapped individual domains over time, such as cognition Pourzinal et al., 2024, autonomic function Chen et al., 2021, and motor severity He et al., 2023. Evaluating these axes in isolation limits our understanding of PD as a multi-system disorder. To bridge this gap, our research undertakes an exploratory investigation using a multivariate longitudinal Latent Class Mixed Model (LCMM). Rather than assuming equal contribution across all symptom domains, this multi-dimensional approach allows the natural variance of the cohort to dictate the clustering, revealing which clinical scales predominantly drive longitudinal heterogeneity.
Finally, we relate these emergent clinical phenotypes to targeted biological metrics. Specifically, further relate these phenotypes to structural MRI, as atrophy patterns track both clinical severity and trans-neuronal spread of PD pathology Zeighami et al., 2015. As highlighted in a recent review Filidei et al., 2025, bridging data-driven subtypes and biological correlates is a critical priority to ensure clinical classifications reflect true pathophysiological differences
Results
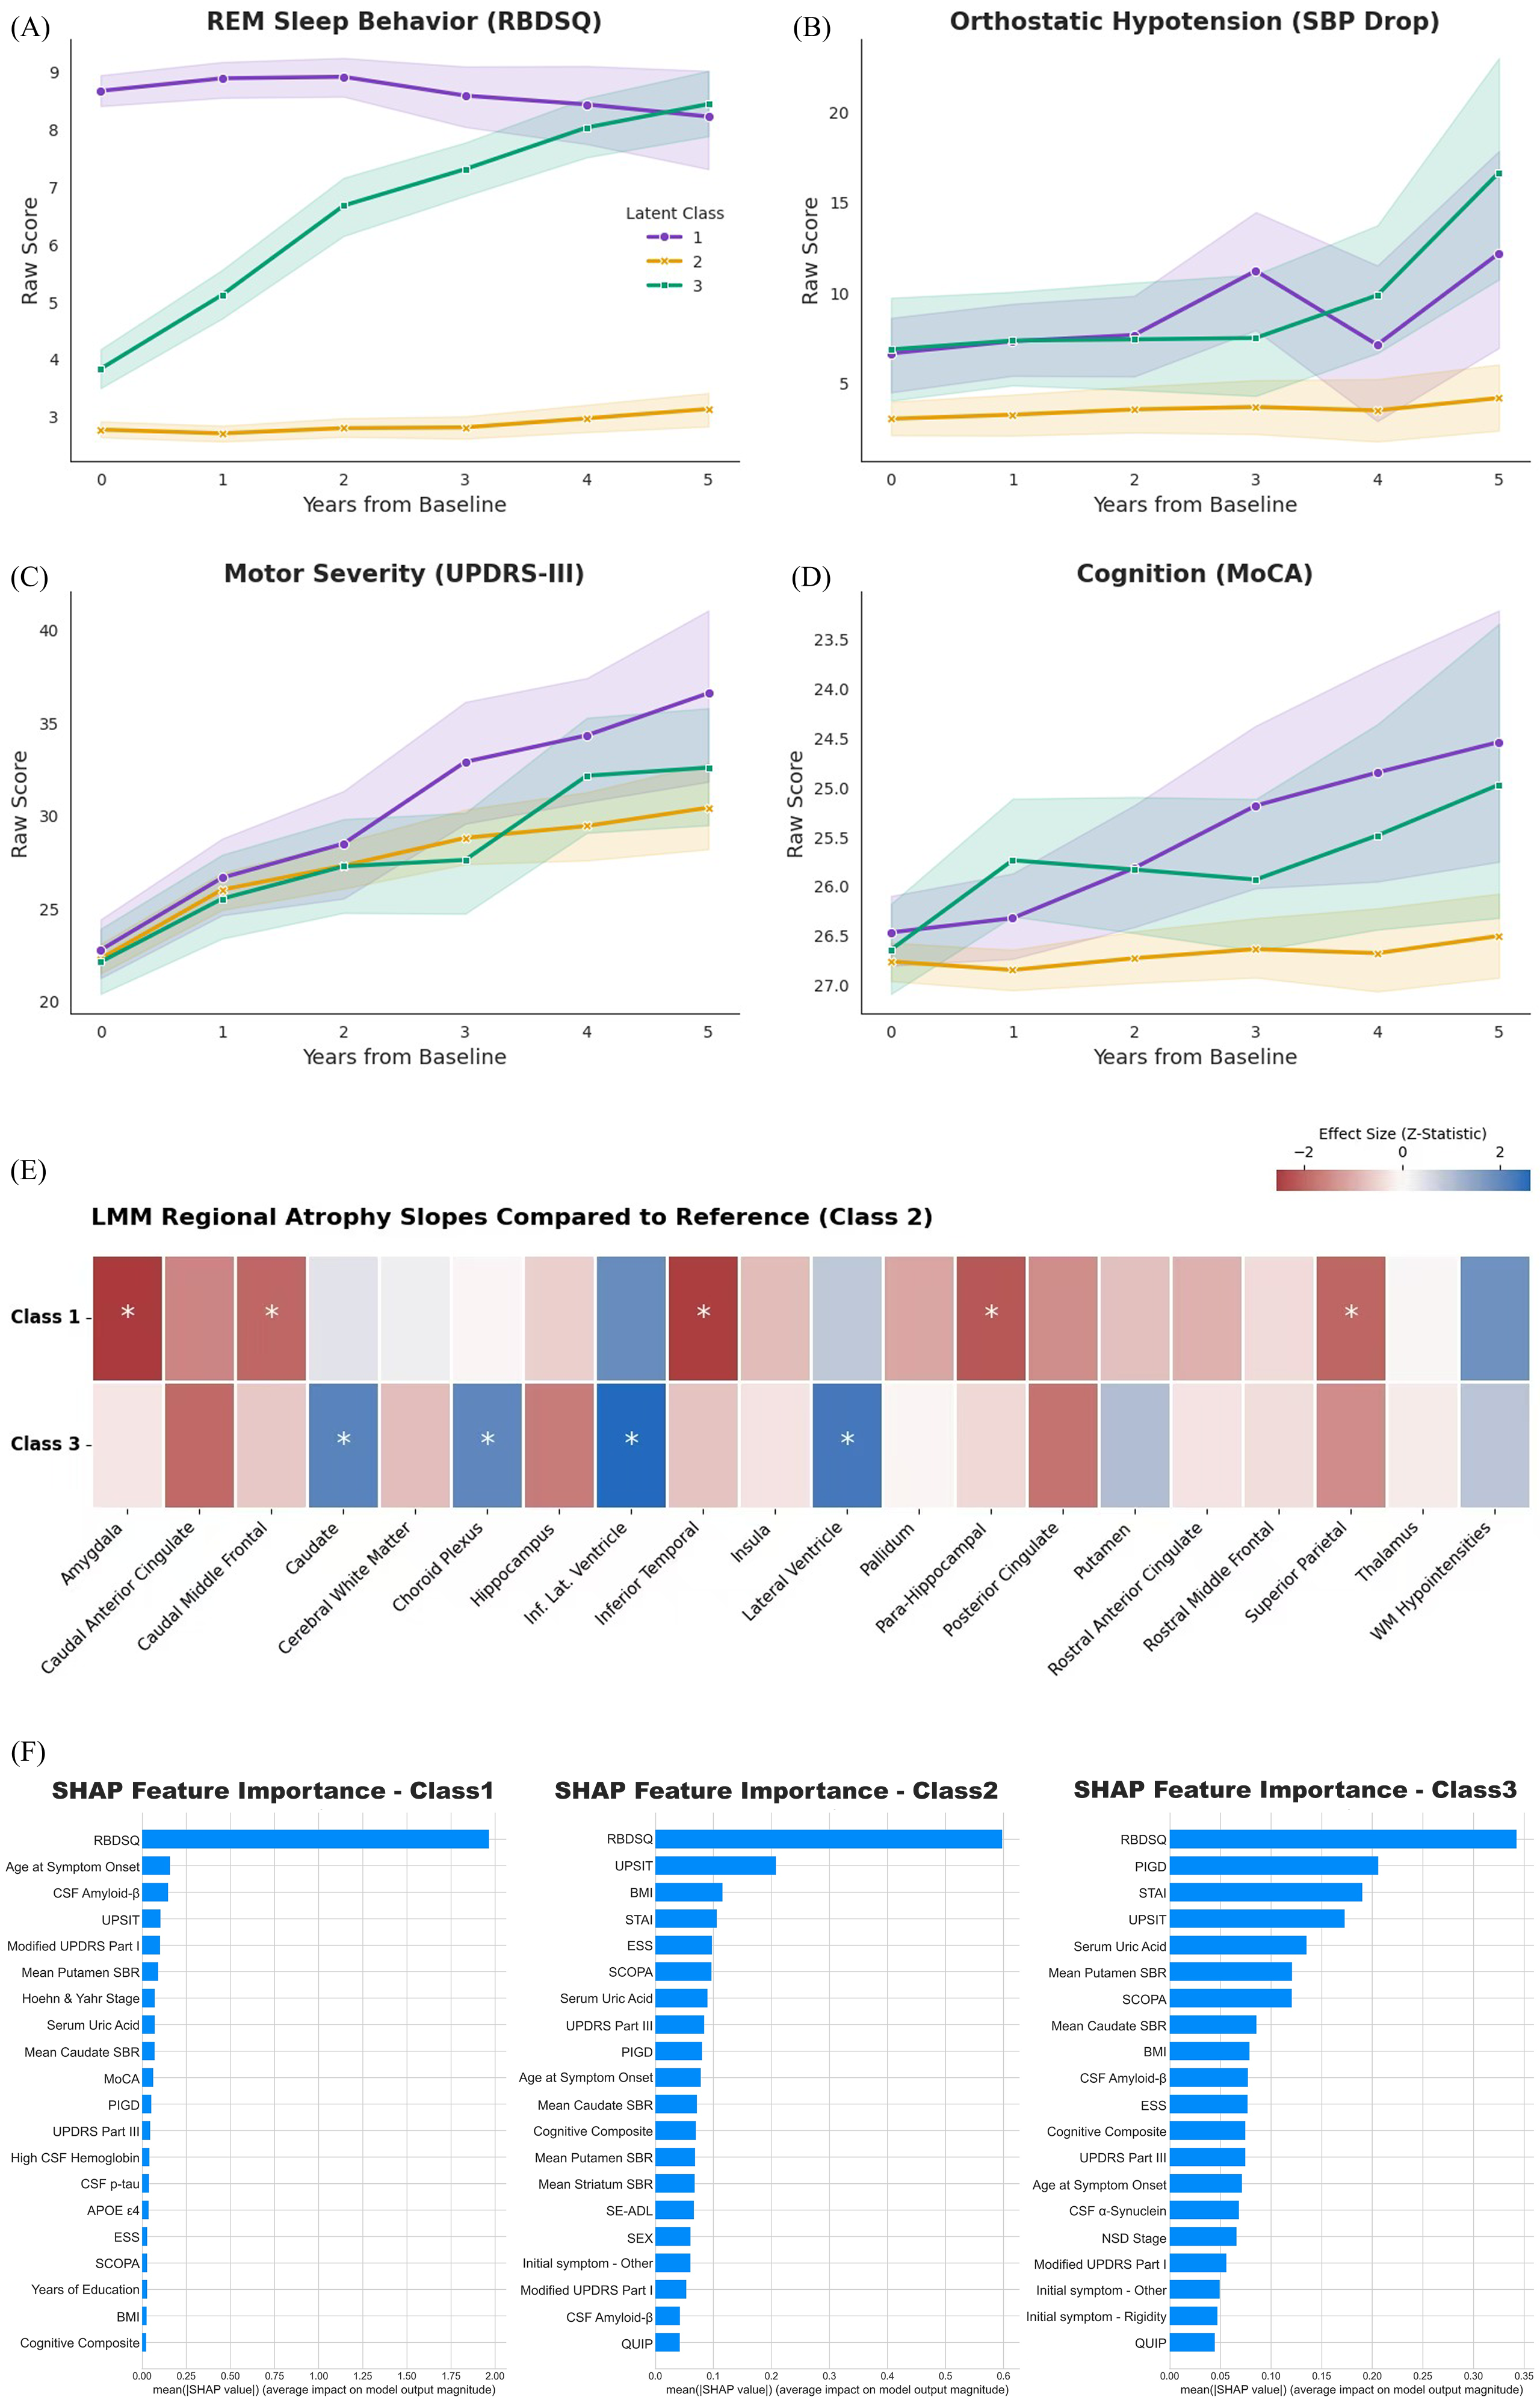
Figure 1:
A–D: Observed mean trajectories of the four class indicator variables defining the multlcmm model. Class 1 = stable high-burden, Class 2 = stable low-burden, Class 3 = increasing-burden.
E: Heatmap of LMM-derived annual change rates for the 20 selected MRI regions. Colors indicate standardized effect sizes (z-statistics); asterisks denote nominally significant differences (unadjusted).
F: Class-specific SHAP feature importance profiles. Bars show mean absolute SHAP values, reflecting the global contribution of baseline features to XGBoost class assignment.
Latent Class Identification and Trajectories
Multivariate LCMM identified a three-class solution as optimal based on the lowest BIC, mean posterior probabilities, class size, and relative entropy criteria (Table 1), see Supp.Methodology for details : a Stable High-Burden class (Class 1, n = 173, 20.2%), a Low-Burden class (Class 2, n = 568, 66.4%), and an Increasing-Burden class (Class 3, n = 114, 13.3%). Observed mean trajectories are shown in Figure 1 (A–D). Class 1 started with the highest REM Sleep Behavior Disorder Screening Questionnaire (RBDSQ) scores, which showed a slight decline by Year 5. Class 2 remained consistently below the cutoff throughout follow-up. Class 3 crossed the cutoff around Year 2 and reached levels comparable to Class 1 by Year 5. For orthostatic systolic blood pressure drop (ΔSBP), Classes 1 and 3 showed increases in later years, while Class 2 remained low. Movement Disorder Society–Unified Parkinson’s Disease Rating Scale Part III (UPDRS Part III) scores increased in all classes, with the steepest rise observed in Class 1. Montreal Cognitive Assessment (MoCA) scores declined over time in Classes 1 and 3, whereas Class 2 remained stable. RBDSQ accounted for the largest variance proportion (39.1%), substantially exceeding ΔSBP (0.74%), MoCA (0.50%), and UPDRS-III (0.20%); the multivariate class structure showed strong agreement with the RBDSQ-only solution (ARI = 0.96; Cramér’s V = 0.95) (Table S1; Table S2). Baseline characteristics are described in Supp.Baseline.
Table 1:Multivariate LCMM model (z-score) selection and classification metrics
| K | Log-likelihood | Relative entropy | AIC | BIC | Proportion per class (%) | Average posterior probability | OCC |
|---|---|---|---|---|---|---|---|
| 1 | -18471.82 | 1.00 | 36969.64 | 37031.40 | 100.00 | ||
| 2 | -18368.28 | 0.79 | 36768.56 | 36844.58 | 28.77 71.23 | 0.89 0.96 | |
| 3 | -18297.93 | 0.75 | 36633.87 | 36724.14 | 20.23 66.43 13.33 | 0.87 0.92 0.79 | 26.00 5.98 24.00 |
| 4 | -18387.10 | 0.27 | 36818.20 | 36922.73 | 33.80 0.35 34.15 31.70 | 0.76 0.35 0.35 0.34 |
Baseline Neuroimaging and Biomarker Associations
Baseline MRI ORs are reported per standard deviation increase to facilitate interpretation, as eTIV-normalized volumes are measured on very small scales. Clinical and biofluid markers remained on their raw scales.
Baseline UPSIT was significantly lower in both the high-burden ( = 0.005) and increasing-burden ( = 0.002) classes (Table 2), validating the model’s capacity to capture external clinical heterogeneity Sun et al., 2025. Whole striatum SBR was also significantly lower in both classes ( = 0.020 and = 0.012, respectively), indicating reduced overall DAT binding which has often been found for early PD patients with pRBD Xu et al., 2025. However, when caudate and putamen SBR were evaluated jointly (Multivariate DAT), neither showed an independent association with class membership. In multivariate MRI regression, smaller baseline thalamic ( = 0.026) and putaminal ( = 0.023) volumes were independently associated with high-burden class membership, whereas larger baseline pallidal volume ( = 0.033) was independently associated with increasing-burden membership.
Longitudinal Structural Change
Longitudinal Linear Mixed Models revealed divergent temporal dynamics between classes (Table 3). The high-burden class showed unadjusted trends of accelerated atrophy across five regions: the amygdala, inferior temporal gyrus, parahippocampal gyrus, superior parietal lobule, and caudal middle frontal gyrus. Conversely, the increasing-burden class exhibited four unadjusted longitudinal trends: slower caudate atrophy alongside accelerated ventricular and choroid plexus expansion.
No regional structural slopes survived False Discovery Rate (FDR) correction across the 20 evaluated regions. Consequently, these longitudinal variations represent exploratory trends rather than definitive trajectory markers.
Table 2:Multinomial Logistic Regression on Baseline Biomarkers (Reference: Class 2). Bolded values indicate . ORs for the Multivariate 2 (MRI) results are standardized, other ORs are given in terms of raw units. Age and Sex were included as covariates in all regressions. Education was additionally included in all regressions except for Multivariate 2.
| Predictor | N | Analysis | Odds Ratio (Class 1) | p-value (Class 1) | Odds Ratio (Class 3) | p-value (Class 3) |
|---|---|---|---|---|---|---|
| Sex (Male=1) | 855 | Demographics | 3.278 | <.001 | 1.633 | 0.093 |
| Education (Years) | 855 | Demographics | 0.975 | 0.471 | 0.984 | 0.718 |
| Age | 855 | Demographics | 1.011 | 0.432 | 1.005 | 0.775 |
| Whole Striatum SBR | 846 | Univariate | 0.324 | 0.020 | 0.136 | 0.012 |
| Caudate SBR (full) | 846 | Multivariate DAT | 0.436 | 0.075 | 0.550 | 0.323 |
| Putamen SBR (full) | 846 | Multivariate DAT | 0.767 | 0.579 | 0.249 | 0.054 |
| UPSIT (full) | 834 | Univariate | 0.963 | 0.005 | 0.948 | 0.002 |
| CSF-SAA (Positive=1) | 796 | Univariate | 1.535 | 0.208 | 5.983 | 0.109 |
| CSF -synuclein | 240 | Multivariate 1 | 0.999 | 0.130 | 1.000 | 0.490 |
| CSF phosphorylated- | 240 | Multivariate 1 | 1.117 | 0.203 | 1.062 | 0.345 |
| CSF amyloid- | 240 | Multivariate 1 | 0.999 | 0.630 | 0.999 | 0.248 |
| UPSIT (overlap) | 240 | Multivariate 1 | 0.966 | 0.233 | 0.954 | 0.076 |
| Serum NfL Chain | 240 | Multivariate 1 | 1.043 | 0.167 | 0.978 | 0.560 |
| Caudate SBR (overlap) | 240 | Multivariate 1 | 0.375 | 0.425 | 1.089 | 0.941 |
| Putamen SBR (overlap) | 240 | Multivariate 1 | 0.163 | 0.222 | 0.098 | 0.092 |
| APOE 4 (Carrier=1) | 240 | Multivariate 1 | 0.911 | 0.875 | 0.744 | 0.575 |
| Thalamus | 474 | Multivariate 2 | 0.596 | 0.026 | 0.868 | 0.527 |
| Putamen | 474 | Multivariate 2 | 0.613 | 0.023 | 0.899 | 0.630 |
| Caudate | 474 | Multivariate 2 | 1.348 | 0.133 | 0.845 | 0.393 |
| Pallidum | 474 | Multivariate 2 | 1.147 | 0.478 | 1.511 | 0.033 |
| Insula | 474 | Multivariate 2 | 1.361 | 0.196 | 0.911 | 0.654 |
| Amygdala | 474 | Multivariate 2 | 1.000 | 0.974 | 0.924 | 0.732 |
| Hippocampus | 474 | Multivariate 2 | 1.537 | 0.058 | 1.036 | 0.903 |
| Inferior Temporal | 474 | Multivariate 2 | 0.954 | 0.807 | 1.057 | 0.776 |
| Para-Hippocampal | 474 | Multivariate 2 | 0.737 | 0.090 | 1.015 | 0.933 |
| Posterior Cingulate | 474 | Multivariate 2 | 1.048 | 0.825 | 0.863 | 0.494 |
| Superior Parietal | 474 | Multivariate 2 | 1.150 | 0.507 | 0.903 | 0.669 |
| Middle Frontal | 474 | Multivariate 2 | 0.863 | 0.386 | 1.024 | 0.903 |
| Anterior Cingulate | 474 | Multivariate 2 | 1.443 | 0.135 | 1.215 | 0.404 |
Table 3:Linear Mixed Models on MRI Volume and Cortical Thickness Trajectories (Reference: Class 2). P-values are shown for the differences in atrophy/expansion between classes. Unadjusted results are indicated in bold. None of the results survived FDR correction. Age and sex were controlled for in all models.
| Region | p-value (Class 1) | FDR q<0.10 (Class 1) | p-value (Class 3) | FDR q<0.10 (Class 3) |
|---|---|---|---|---|
| Thalamus | 0.950 | 0.990 | 0.835 | 0.879 |
| Caudate | 0.684 | 0.808 | 0.036 | 0.204 |
| Putamen | 0.433 | 0.618 | 0.306 | 0.680 |
| Hippocampus | 0.561 | 0.748 | 0.090 | 0.258 |
| Choroid Plexus | 0.990 | 0.990 | 0.044 | 0.204 |
| Pallidum | 0.271 | 0.542 | 0.990 | 0.990 |
| Lateral Ventricle | 0.393 | 0.618 | 0.020 | 0.202 |
| Inf. Lat. Ventricle | 0.054 | 0.180 | 0.009 | 0.177 |
| Cerebral White Matter | 0.799 | 0.888 | 0.430 | 0.782 |
| WM Hypointensities | 0.067 | 0.192 | 0.378 | 0.756 |
| Amygdala | 0.010 | 0.120 | 0.768 | 0.853 |
| Insula | 0.414 | 0.618 | 0.757 | 0.853 |
| Inferior Temporal | 0.012 | 0.120 | 0.470 | 0.783 |
| Para-Hippocampal | 0.028 | 0.180 | 0.651 | 0.853 |
| Posterior Cingulate | 0.148 | 0.330 | 0.069 | 0.231 |
| Superior Parietal | 0.047 | 0.180 | 0.145 | 0.363 |
| Rostral Middle Frontal | 0.686 | 0.808 | 0.701 | 0.853 |
| Caudal Middle Frontal | 0.049 | 0.180 | 0.512 | 0.788 |
| Rostral Anterior Cingulate | 0.340 | 0.618 | 0.751 | 0.853 |
| Caudal Anterior Cingulate | 0.116 | 0.291 | 0.051 | 0.204 |
Early-Stage Subtype Prediction
The XGBoost model achieved an AUC of 0.88 and cross-validated balanced accuracy of 0.73. Baseline RBDSQ was the single most discriminative predictor of class membership by both split frequency and information gain, tripling the next-ranked feature. Class-specific SHAP analysis (Figure 1 (F)) revealed that Class 1 was overwhelmingly driven by RBD severity; Class 2 showed a more distributed profile led by RBD, olfactory function, autonomic dysfunction, and anxiety; and Class 3 had the broadest SHAP profile with postural instability and dopaminergic imaging as notable contributors, consistent with its lower classification accuracy (F1 = 0.36). CSF α-synuclein SAA ranked prominently in native tree metrics but not in SHAP values, reflecting population-level rather than patient-level discriminative utility.
Discussion
While RBD is a well-established prognostic marker, it is typically deployed as a static or binary baseline feature Velucci et al., 2025Liu et al., 2021. Our findings highlight its dynamic evolution: longitudinal RBDSQ trajectories contributed the majority of variance, driving the latent class structure and demonstrating that RBD-related heterogeneity persists well beyond the prodromal stage.
This longitudinal approach yields markedly different prognostic insights compared to baseline clustering. For instance, the highly cited diffuse/malignant phenotype Fereshtehnejad et al., 2015 couples a wide breadth of severe baseline symptoms with rapid global progression. While our Class 1 shares this severe baseline multi-domain profile (Supp.Baseline) and resembles the RBD+ cluster Velucci et al., 2025, its symptom progression was not exclusively the most rapid. Instead, Class 3 demonstrated the steepest multi-domain deterioration despite much milder baseline symptoms. Because our multivariate LCMM models domain-specific trajectories rather than collapsing metrics into a single composite score, these results suggests that initial symptom burden and progression rate represent distinct, decoupled dimensions of PD heterogeneity.
Our trajectory-derived subtypes align more closely with longitudinal RBD progression studies than with traditional baseline clustering. Our data-driven classes mirror the a priori groups defined by Ye et al. (2022). Their largest group, the non-RBD-stable phenotype, matches our low-burden stable class (Class 2). Our Class 3 strongly aligns with their “late-RBD” group (12.1% of their cohort), showing a late-emerging probable RBD trajectory that crosses the clinical threshold around Year 2. This transitional, high-risk phenotype exhibits baseline olfactory impairment and orthostatic hypotension Y. Saitoh et al., 2018. Our high-burden Class 1 likely represents a combination of their pRBD-stable and pRBD-reversion phenotypes—supported by a slight reversion in Class 1’s RBDSQ during Years 4 and 5.
The independent associations identified in the multivariable MRI regression are not directly comparable with most previous neuroimaging studies, which primarily relied on univariate statistical tests. Kruskal-Wallis tests identified overall differences for the thalamus ( = 0.005) and putamen ( = 0.036), but not the pallidum ( = 0.226) (Supp.Baseline), while post-hoc Dunn’s tests identified no significant pairwise differences. Together, these findings suggest that adjusting for demographic covariates and for the shared variance between regions improved the identification of pairwise class-specific associations. The thalamic and putaminal findings are consistent with their identification as early structural markers in pRBD Boucetta et al., 2016Ellmore et al., 2010Rahayel et al., 2019Salsone et al., 2014. Evidence for baseline pallidal volumetric differences is limited. However, pallidal shape contraction has been reported predominantly in PD patients without RBD Rahayel et al., 2019, while pallidal hypertrophy has also been observed in PD patients with excessive daytime sleepiness compared to patients without Gong et al., 2020, suggesting that larger pallidal volumes relative to the low-burden reference class are not necessarily implausible. Nevertheless, given the relatively small MRI sample for the increasing-burden class (n = 63), this finding requires validation in another cohort.
Although longitudinal structural alterations did not survive strict FDR correction, their unadjusted trends offer exploratory mechanistic insights. The high-burden class exhibited accelerated atrophy in the amygdala, parahippocampal gyrus, and superior parietal lobule. Amygdalar atrophy directly aligns with longitudinal pRBD findings Yoon & Monchi, 2021 and contextualizes this cohort’s significantly elevated baseline depression and anxiety (GDS/STAI). Furthermore, parahippocampal and superior parietal thinning mirror longitudinal structural progression patterns distinguishing RBD from non-RBD PD phenotypes Ye et al., 2022. Conversely, the increasing-burden class trended toward accelerated ventricular and choroid plexus expansion—radiological markers of widespread central atrophy and altered CSF dynamics linked to impaired glymphatic clearance He et al., 2023.
Finally, while we did not directly measure α-synuclein pathology, these distinct trajectories tentatively align with proposed models of Lewy body spatial progression. Class 1’s early concurrent triad of RBD, autonomic, and olfactory dysfunction resembles a “body-first” or brainstem-early trajectory Borghammer & Van Den Berge, 2019Mastenbroek et al., 2024. Conversely, Class 3’s post-motor RBD onset and rapid cognitive decline suggests a “brain-first” origin with delayed, steep brainstem involvement. Class 2, persistently lacking RBD, may represent a phenotype where pathology remains temporarily confined to olfactory regions. Ultimately, the longitudinal timing of RBD expression appears to carry critical, albeit interpretive, pathophysiological weight.
Supplementary material
List of Abbreviations
Methodology
Participants
Data acquired from Parkinson’s Progression Markers Initiative (PPMI) dataset (https://
Participants were included if they met the following criteria at baseline: (1) drug-naïve with a levodopa equivalent daily dose (LEDD) of 0; (2) disease duration within 2 years; (3) early-stage disease defined by Hoehn-Yahr stage < 3; (4) no dementia; and (5) age onset ≥ 50 years to exclude early-onset Parkinson’s disease. Participants were followed for up to 5 years, and only those with two or more follow-up visits were included, resulting in a total of 855 participants with Parkinson’s disease.
Trajectory analysis
Analyses were performed in R (v4.5.3) and Python (v3.12.13). multlcmm function in the R package lcmm Proust-Lima et al., 2017 was applied for trajectory analysis. This approach follows the rationale of group-based trajectory modeling Nagin & Odgers, 2010, allowing several longitudinal markers measured on different clinical scales, to inform a common underlying latent disease process while accounting for marker-specific measurement relationships. Latent classes and individual membership probabilities were estimated within a maximum-likelihood framework, providing asymptotically unbiased parameter estimates under a missing-at-random (MAR) assumption. Follow-up time since baseline, measured in years, was used as the time indicator. The following steps were performed to optimize the analysis:
Literature-informed scale selection: Candidate scales were chosen to represent major PD progression domains based on prior subtyping studies. The initial set included RBDSQ, SCOPA-AUT, STAI, age- and education-adjusted SDMT T-scores, and the MDS-UPDRS Part III OFF-medication score (UPDRS Part III) Velucci et al., 2025He et al., 2023. However, modeling above five scales together failed to meet minimum criteria: mean posterior probabilities > 0.7 or minimum class proportions > 5%.
Indicator refinement: To ensure model constrction from scales with longitudinal signals and optimal class seperation, we evaluated candidate scales in univariate LCMM, and prioritized scales that had been studied in univariate model. The final set is RBDSQ, MoCAWang et al., 2025, UPDRS Part III, ΔSBP Chen et al., 2021.
Link function & distributioanl consideration: Although nonlinear link functions better accommodate ceiling/floor effects and curvilinearity of psychometric scales Proust-Lima et al., 2011, their application in our multivariate framework resulted in reduced classification quality (relative entropy <0.7 or OCC <5). Therefore, a linear link function was adopted for all indicators. To address MoCA’s known curvilinearity and ceiling effect, square root transformation was applied prior to modeling Wang et al., 2025.
Random effects specification: Models with random intercept-slope and random intercept only were both evaluated. Both identified a 3-class solution as optimal under linear link; however, the random intercept-slope model did not converge. The final model therefore specified random intercept only, with fixed and mixture components including both intercept and slope terms.
Model selection: Models with 1 to 4 classes were fitted. The final model was selected based on lowest BIC, mean posterior probabilities >70%, minimum class size >5%, and relative entropy >0.7 Lennon et al., 2018.
Scale contribution assessment: Residual standard error and variance explained proportion were examined to evaluate each indicator’s contribution to the multivariate model.
Class assignment validation: To assess the consistency of class solutions, comparisons were performed using confusion matrices, Adjusted Rand Index (ARI), and Cramér’s V.
Sensitivity analyses: Models were initially estimated using raw/pre-transformed scores. As z-standardized scores yielded identical class solutions (ARI = 1, Cramér’s V = 1) while facilitating convergence in downstream analyses, z-standardized scores were adopted as the primary model specification.
Missingness and attrition
The missing rates for RBDSQ, MoCA, ΔSBP, and UPDRS Part III were 0.88%, 1.09%, 2.99%, and 15.99%, respectively. LCMM accommodates incomplete longitudinal data, so no additional missingness handling was performed. Little’s MCAR test was significant (χ² = 208, df = 28, p < .001), indicating that data were not missing completely at random. Differential attrition was observed across classes, with Year 5 completion rates of 20.2%, 28.5%, and 41.2% for Classes 1, 2, and 3, respectively. As Class 1 also exhibited the overall highest baseline disease burden, attrition was likely associated with observed disease severity, supporting MAR as a reasonable assumption. Although LCMM is expected to limit the impact of differential attrition under MAR, later trajectory estimates for Class 1 are based on a smaller and potentially less severely affected subsample, which may limit their representativeness.
Clinical assessments
The above selected four input clinical scales, each representing a core clinical domain (sleep, cognitive, autonomic, and motor):
REM sleep behavior disorder (RBD): Defined by a score ≥5 on the REM Sleep Behavior Disorder Screening Questionnaire (RBDSQ), a 10-item self-report instrument (maximum total score 13 points) designed to screen for RBD Stiasny-Kolster et al., 2007.
Global cognitive function: Assessed through the Montreal Cognitive Assessment (MoCA), adjusted for education. A score below 26 was used as the cutoff for cognitive impairment Nasreddine et al., 2005.
Orthostatic hypotension: Quantified as the orthostatic change in systolic blood pressure (ΔSBP, supine SBP minus standing SBP upon standing). A ΔSBP ≥20 mmHg within 3 min of standing was considered indicative of clinically significant orthostatic hypotension Freeman et al., 2011.
Motor severity: Evaluated using the Movement Disorder Society – Unified Parkinson’s Disease Rating Scale (MDS-UPDRS) Part III. A score between 33 to 58 was considered moderate motor impairment Martínez-Martín et al., 2015.
MRI processing
Baseline morphological and quality control data were obtained directly from the PPMI repository, derived from the FreeSurfer (v7.3.2) and MRIQC (v23.1.0) pipelines within the nipoppy framework Bhagwat et al., 2023. To extend this to a longitudinal framework while maintaining computational efficiency, we independently processed all participants with available structural MRI at two or more visits (n = 382 of the total N = 855 inclusion cohort) using FastSurfer (v2.4.2) Henschel et al., 2020. A total of 1036 scans were segmented, with volume statistics collated for regions defined by the Desikan-Killiany Atlas Desikan et al., 2006. One participant was subsequently excluded due to technical issues involving missing entries and extreme hemispheric asymmetry. The specific processing parameters and code for this pipeline are documented in the Colab notebooks within our GitHub repository.
Quality control for the Freesurfer data involved a rigorous outlier detection process using the Gap Statistic algorithm Tibshirani et al., 2001 via the GapStatistics Python package Loehr & Musab, 2025. We focused on three key MRIQC metrics: the coefficient of joint variation (CJV), contrast-to-noise ratio (CNR), and entropy focus criterion.
Secondary Analysis
Relating latent class models to external variables requires careful handling of estimation bias. The traditional one-step method where covariates and the latent class model are estimated simultaneously often suffers from model instability, as the inclusion of predictors can shift the latent structure itself. To avoid this, many studies fall into the trap of the “naive” three-step method (assigning participants to classes before regression), which produces biased parameter estimates by ignoring classification uncertainty. We instead employed the improved three-step and two-step frameworks developed to account for this uncertainty Bolck et al., 2004Vermunt, 2010Bakk & Kuha, 2018Nylund-Gibson & Masyn, 2016. Specifically, we utilized the externVar function in the lcmm package Proust-Lima et al., n.d., opting for the two-step method over the three-step bootstrap to maintain computational efficiency while achieving comparable bias reduction.
Because the two-step regression function explicitly accounts for latent class assignment uncertainty, it requires substantially more parameters than a conventional regression model. Attempting to fit all predictors into a single unified model led to non-convergence (the algorithm destabilized with >15 predictors) and would have caused severe sample reduction due to varying missingness profiles across modalities. Consequently, a tiered modelling strategy was implemented. Non-MRI variables (UPSIT, fluid biomarkers, and DAT imaging) were evaluated in a complete-case overlap cohort (N = 240, denoted Multivariate 1 in the Results section), while MRI-derived regional volumes and cortical thicknesses were evaluated in a dedicated parallel model (N = 474, Multivariate 2 in the Results section).
To avoid unnecessary loss of information, UPSIT and the SBRs from DAT imaging were additionally evaluated in available-case regressions using their full respective cohorts (N = 834 and N = 846), as restricting these variables to the overlap cohort would have reduced the available sample by more than threefold. Whole striatum SBR was analysed in a univariate regression to provide an overall picture of DAT binding differences between classes, whereas caudate and putamen SBRs were evaluated jointly for any associations with class membership independent of each other (Multivariate DAT in the Results section). The available-case results for UPSIT and DAT imaging are reported alongside the overlap results for these variables, to determine whether restricting the sample primarily affected statistical power or materially altered the estimated associations.
Due to extreme data sparsity of the categorical CSF SAA variable, it was analysed only in its independent available-case model (N = 796) to prevent sparse-data bias from corrupting concurrent covariates, as this effect has been noted to potentially be more detrimental than missing-variable bias Greenland et al., 2016. Furthermore, SAA was binarized into “LBD-like” and “other” (combining MSA-like, inconclusive, and negative results), as these alternate categories were too sparse to be modelled independently even within the larger available-case cohort. For the fluid biomarkers, red blood cells represent a significant source of interference in α-synuclein assays Barbour et al., 2008. To account for this, we leveraged the PPMI hemoglobin (Hb) threshold indicators. Comparative analysis confirmed that α-synuclein levels did not differ significantly in median (Mann-Whitney U, = 0.627) or distribution (Kolmogorov-Smirnov, = 0.495) between samples with detectable Hb (N = 60) and those without (N = 265); consequently, the full sample was retained to maximize statistical power. Associations between monogenic PD variants and class membership were not evaluated due to the high prevalence of sporadic cases (N = 808, 94.5%). Similarly, APOE 4 status was binarized (carrier vs. non-carrier) because homozygous cases were too infrequent for independent analysis.
For the cross-sectional multinomial logistic regression, we utilized a mix of volume and thickness metrics derived from FreeSurfer, depending on the specific region. Subcortical volumes were normalized by estimated Total Intracranial Volume (eTIV) to account for head size Voevodskaya et al., 2014, while cortical thicknesses were normalized by mean cortical thickness. For the longitudinal Linear Mixed Models (LMM) investigating atrophy and ventricular expansion rates, we utilized FastSurfer outputs. Because FastSurfer does not provide an eTIV estimate, these volumes were instead normalized using MaskVol; this shift was a necessary adaptation to the respective software pipelines rather than a change in statistical strategy. Notably, FastSurfer segmentation directly provides volumes for cortical regions, allowing us to include them in the longitudinal analysis without the need to run time-intensive surface reconstructions across multiple timepoints.
Given the strict parameter limits of the uncertainty-adjusted regression, structural predictor selection required targeted refinement. Because our derived latent classes were predominantly characterized by their evolving REM sleep behaviour disorder (RBD) phenotypes, we restricted a priori region of interest (ROI) selection to 13 specific cortical and subcortical structures demonstrated in the literature to differ morphologically between PD patients with and without RBD Boucetta et al., 2016Ellmore et al., 2010Rahayel et al., 2019Salsone et al., 2014Lim et al., 2016Ye et al., 2022Yoon & Monchi, 2021. Comparisons to healthy controls were omitted from this rationale as our models exclusively evaluated intra-disease phenotypic progression. To prevent multicollinearity in the regression, left and right hemisphere outputs were averaged across all regions. Additionally, we consolidated the caudal and rostral sub-regions of the anterior cingulate and middle frontal cortices by summing their volumes, as the broader neuroimaging literature rarely distinguishes between these specific Desikan-Killiany parcellation subdivisions. Multicollinearity among the final selected predictors was assessed using Variance Inflation Factors (VIF) via the car library John Fox & Sanford Weisberg, 2019, with all predictors yielding acceptable values (VIF < 4).
The relationship between class membership and longitudinal atrophy was implemented using the hlme function via LMM. We acknowledge that this longitudinal analysis utilized a modal (naive) class assignment, as a corrected bias-adjustment method for LMMs was not available in the current lcmm implementation. Because the LMMs were treated as an exploratory longitudinal extension, the caudal and rostral parts of the cortical regions were analysed independently rather than summed. We also expanded this longitudinal analysis to include several additional whole-brain metrics: the ventricles (as indicators of general central atrophy), the choroid plexus (a marker of altered glymphatic clearance) He et al., 2023, total cerebral white matter (a marker of general structural connectivity), and white matter hypointensities, which served as a marker of white matter lesion burden Wei et al., 2019.
XGBoost
We employed XGBoost, a gradient boosting framework optimised for tabular data, to predict LCMM-derived latent classes from baseline features with the aim of developing a lightweight predictive model. The dataset included PATNO, LCMM class assignment, age, sex, race, baseline clinical scales, DaTScan features, genetics, biofluid markers. The dataset was split into training, validation, and test sets at a 70:15:15 ratio. Hyperparameters were optimised using random search over 100 configurations with 3-fold cross-validation. Sample weights and balanced accuracy were used to address class imbalance. Model performance was evaluated using AUC, and SHAP was used to interpret the XGBoost results.
Limitations, Strengths, and Future Directions
Cohort and Clinical Measurement Constraints
Several limitations should be considered when interpreting these findings. First, while the PPMI dataset provides an unprecedented de novo PD cohort, it represents a highly educated, predominantly white demographic that excludes atypical parkinsonism or early dementia, limiting immediate generalizability to broader clinical populations. Clinically, REM sleep behavior disorder was assessed via the RBDSQ rather than polysomnography, reflecting probable symptom trajectories (pRBD) rather than confirmed diagnoses. Additionally, simplifying the multisystem complexity of PD by representing each clinical domain with a single scale, alongside collecting data post-diagnosis, prevents us from inferring the exact temporal order of early pathological events or -synuclein propagation.
Statistical Modeling, Missing Data, and Distal Outcomes
Second, the use of Latent Class Mixed Models (LCMM) inherently assumes discrete categorical subpopulations within a continuous neurodegenerative spectrum. While LCMM natively handles missing longitudinal data, our secondary covariate analysis evaluates baseline variables as class predictors using a bias-adjusted 2-step method (externVar). This framework highlights associations rather than strict causality and is currently restricted to a complete-case subset with overlapping biomarker data. To eliminate missing variable bias and leverage the full cohort for secondary inference, future work will implement multiple imputation for these baseline biomarkers. Furthermore, while externVar was deployed here exclusively for baseline predictors, it can also be used in future iterations of this work to relate trajectory classes directly to distal clinical outcomes, such as reaching Hoehn & Yahr Stage 3, mild cognitive impairment (MCI), and dementia.
Neuroimaging Feature Selection and Pipeline Consistency
Third, our structural MRI analysis was restricted to a targeted subset of mostly subcortical regional volumes. This restricted feature selection was a strict statistical necessity: the parameter-heavy, bias-adjusted 2-step method introduces severe convergence issues if overloaded with variables, constraining our initial model and leaving broader cortical alterations unexplored. To resolve this and expand our feature space into cortical thickness and broader regional volumes, future work will integrate a wider array of cortical metrics. To ensure strict within-subject consistency across these expanded longitudinal metrics, future iterations will transition from standard automated segmentation to a dedicated longitudinal pipeline utilizing FastSurfer with Surf-Recon, contingent on sufficient computational resources.
Study Strengths
Despite these limitations, our longitudinal multidomain approach successfully identifies progression phenotypes based on within-person change rather than static baseline severity alone. The robust associations demonstrating clear alignment between these latent trajectory classes and underlying clinical, biomarker, and MRI features strongly support their physiological relevance to dissecting PD heterogeneity.
Table S1:RBDSQ LCMM model selection and classification metrics
| K | Log-likelihood | Relative entropy | AIC | BIC | Proportion per class (%) | Average posterior probability | OCC |
|---|---|---|---|---|---|---|---|
| 1 | -7504.38 | 1.00 | 15016.75 | 15035.76 | 100.00 | ||
| 2 | -7403.28 | 0.80 | 14820.56 | 14853.82 | 27.37 72.63 | 0.90 0.96 | |
| 3 | -7326.08 | 0.76 | 14672.16 | 14719.67 | 19.30 66.43 14.27 | 0.87 0.92 0.79 | 27.90 6.11 23.10 |
| 4 | -7326.08 | 0.54 | 14678.16 | 14739.92 | 15.32 19.42 65.26 0.00 | 0.77 0.87 0.68 NaN |
The 4-class model yielded an empty class (0.00%) and undefined posterior probability (NaN), indicating a degenerate solution.
Table S2:Comparison of class assignments between the z-score multivariate LCMM model (A) and the RBD-only LCMM model (C)
| A: Class 1 | A: Class 2 | A: Class 3 | Total | |
|---|---|---|---|---|
| C: Class 1 | 163 | 2 | 0 | 165 |
| C: Class 2 | 1 | 564 | 3 | 568 |
| C: Class 3 | 9 | 2 | 111 | 122 |
| Total | 173 | 568 | 114 | 855 |
ARI = 0.956; Cramér’s V = 0.950.
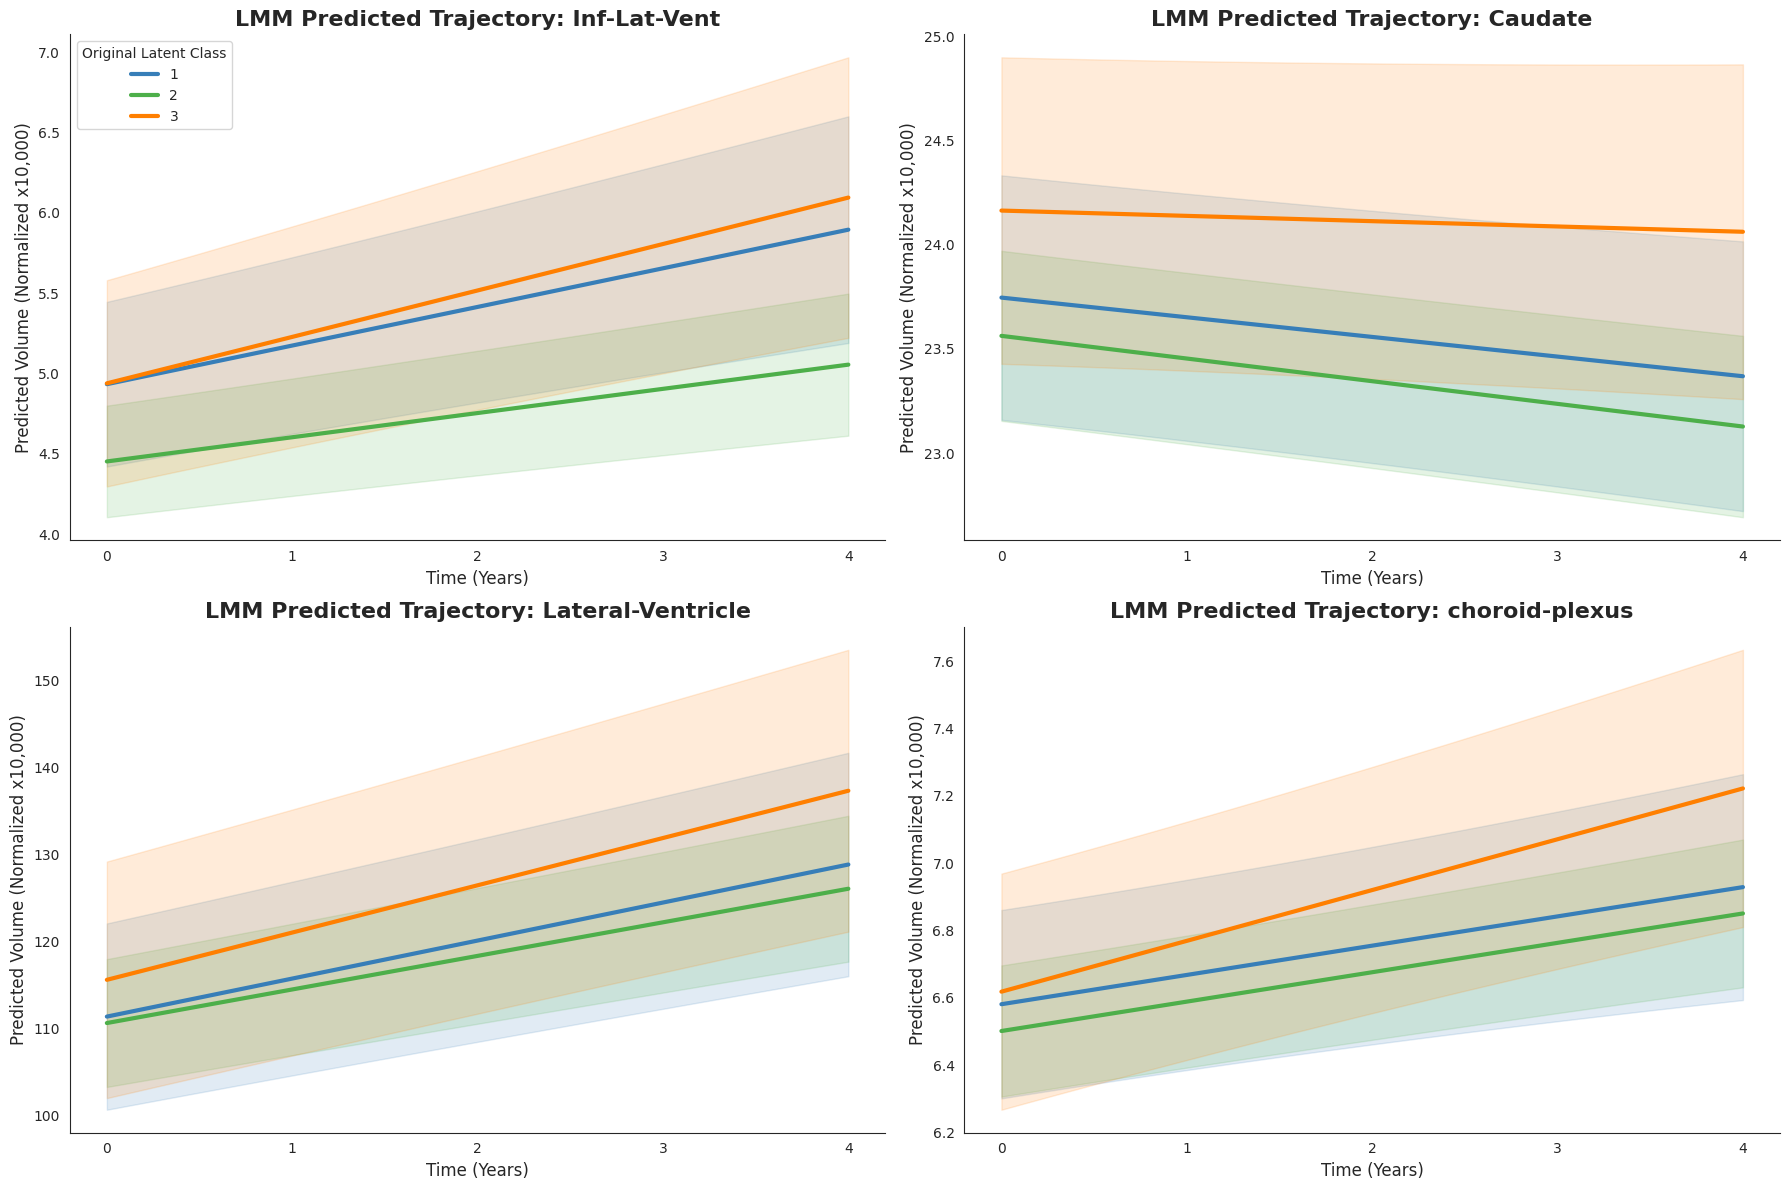
Figure S1:LMM Predicted Trajectories, for regions where nominal differences were found between Class 2 and Class 3
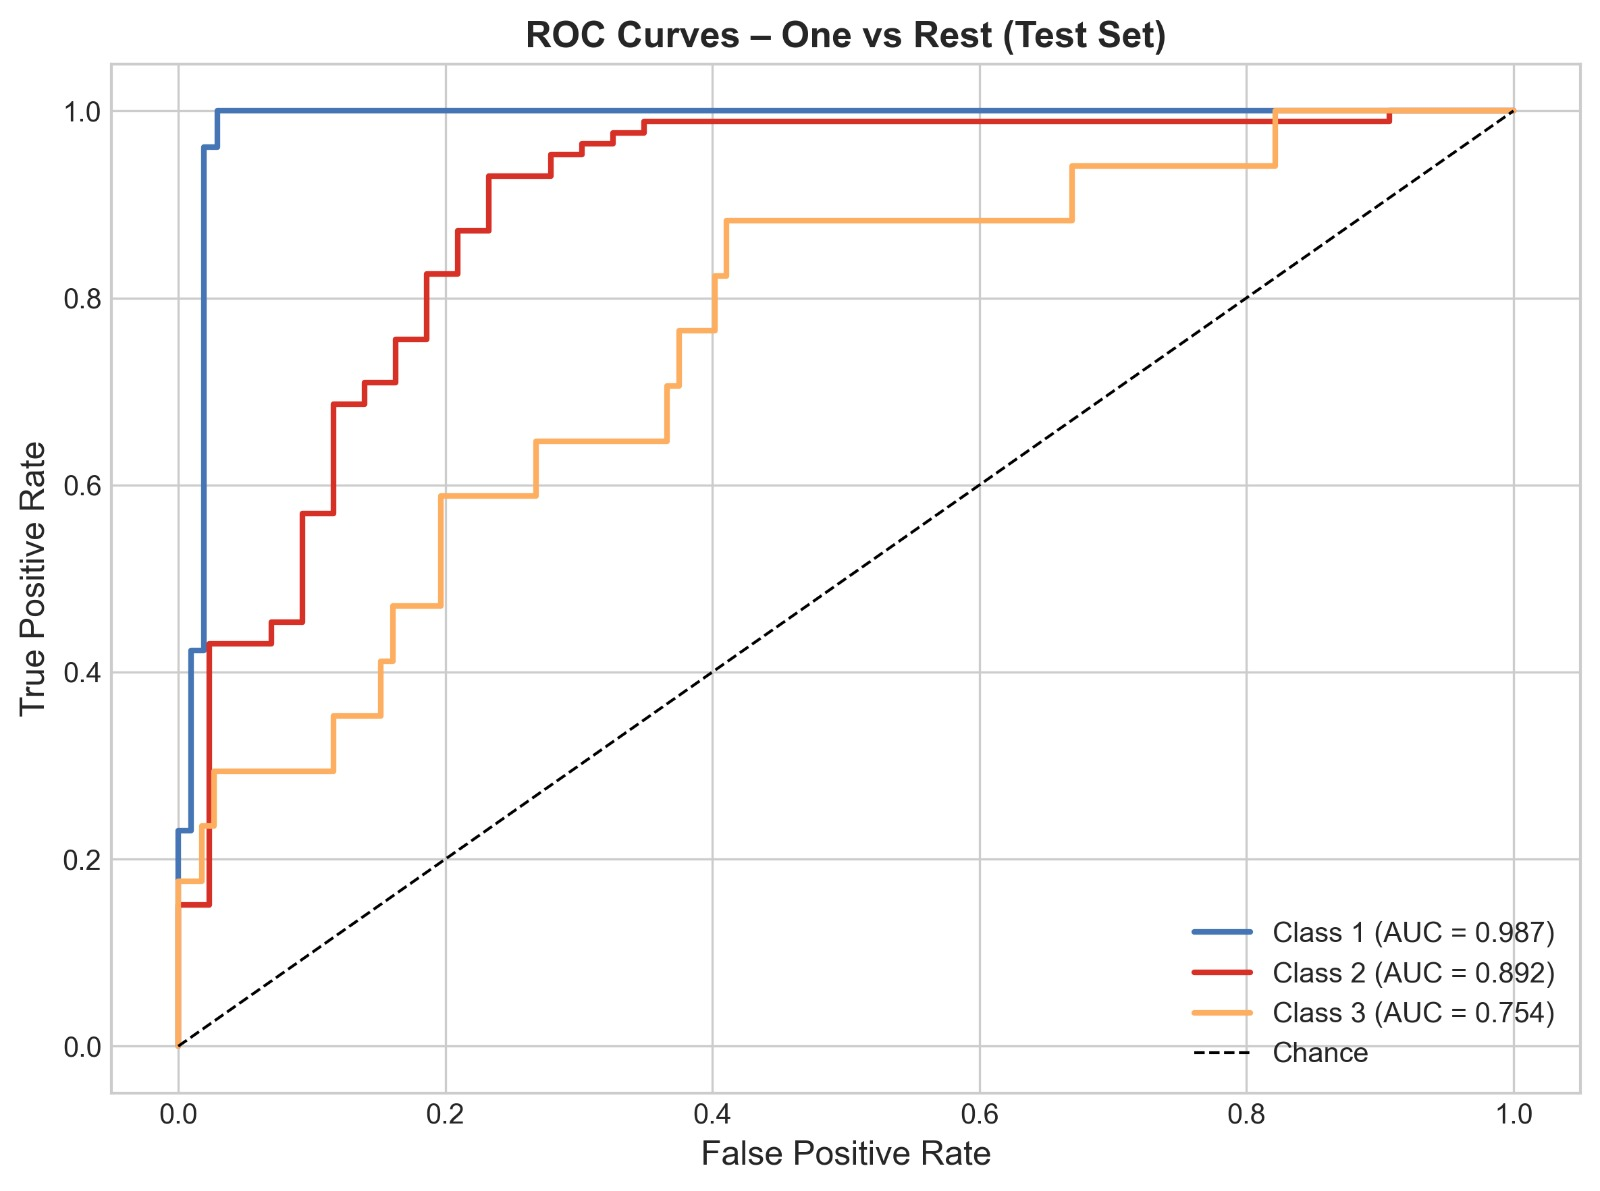
Figure S2:ROC curves for one-vs-rest on the test set
Baseline Characteristics
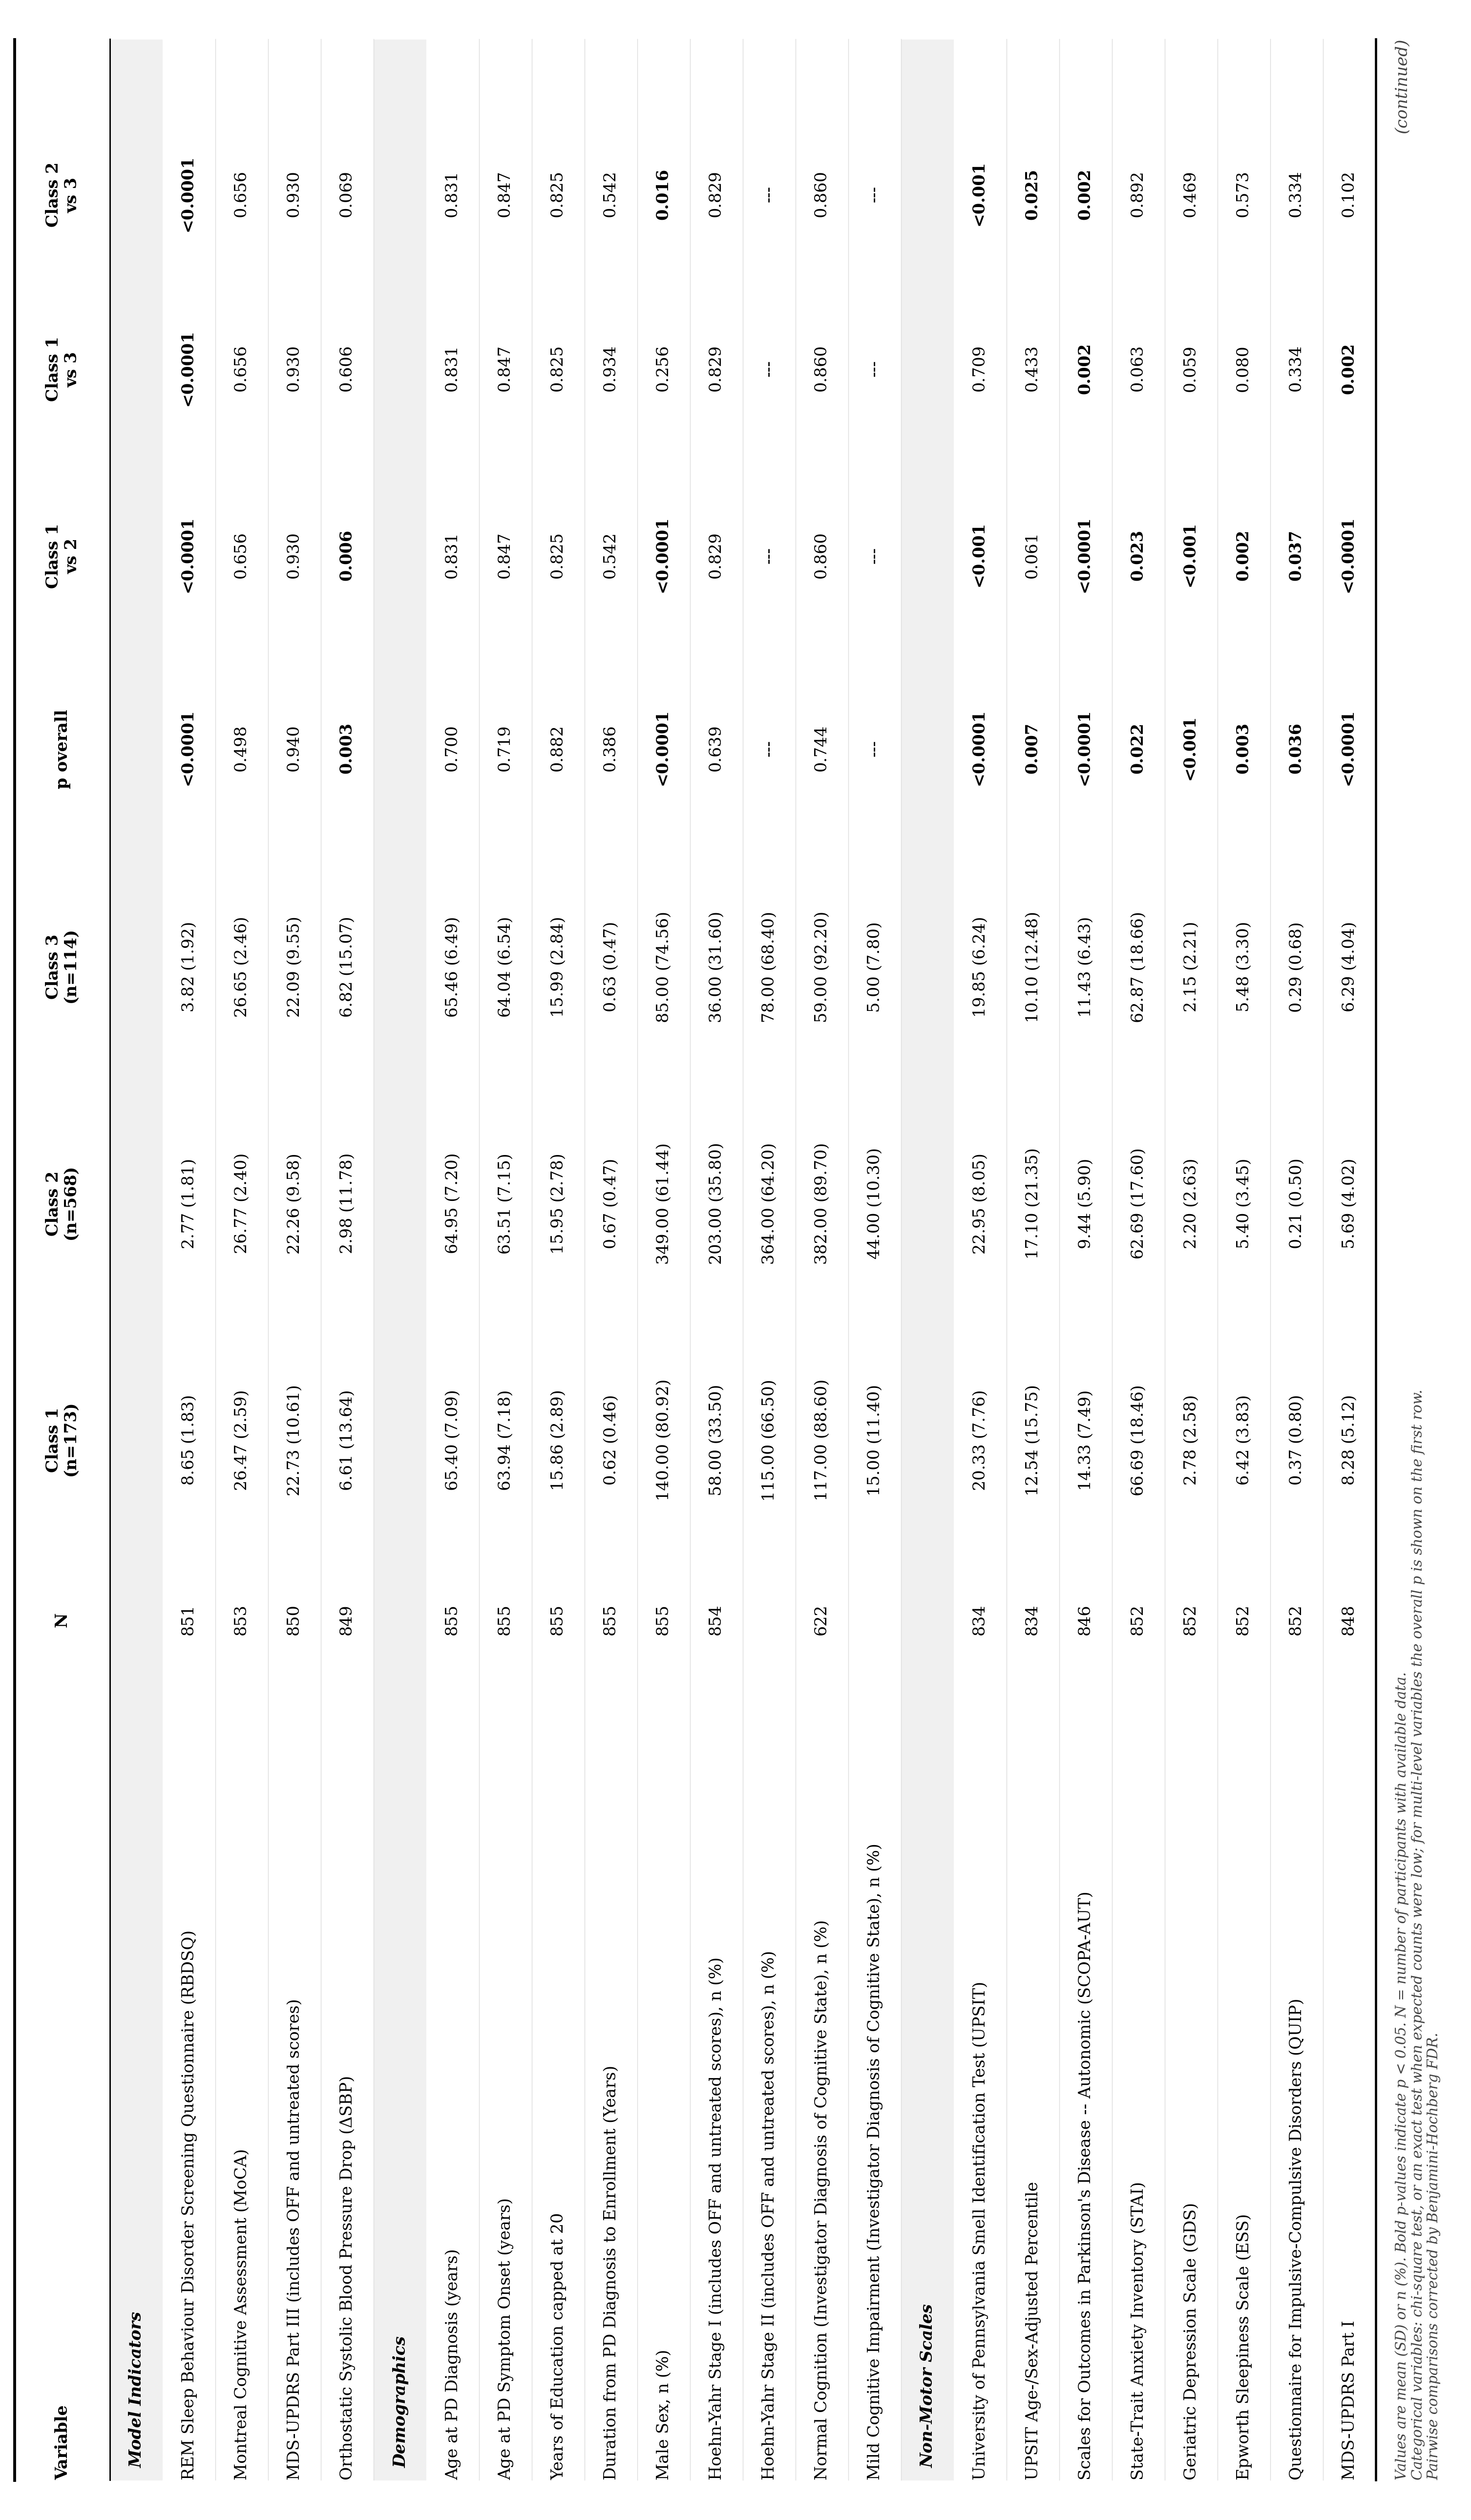
Baseline characteristics across the three classes were compared using the Kruskal–Wallis test for continuous variables. For categorical variables, the chi-square test was used by default; when expected cell frequencies were small (any expected count < 1, or more than 20% of cells with an expected count < 5), an exact test was applied instead. Specifically, Fisher’s exact test was used for 2×2 tables and a Monte Carlo–based Fisher’s exact test for larger R×C tables. Pairwise comparisons between classes were performed using Dunn’s test for continuous variables and the same chi-square/exact-test procedure for categorical variables, with Benjamini–Hochberg false discovery rate (FDR) correction applied across the pairwise comparisons within each variable. Continuous variables are expressed as mean ± standard deviation (SD), and categorical variables as number (percentage).
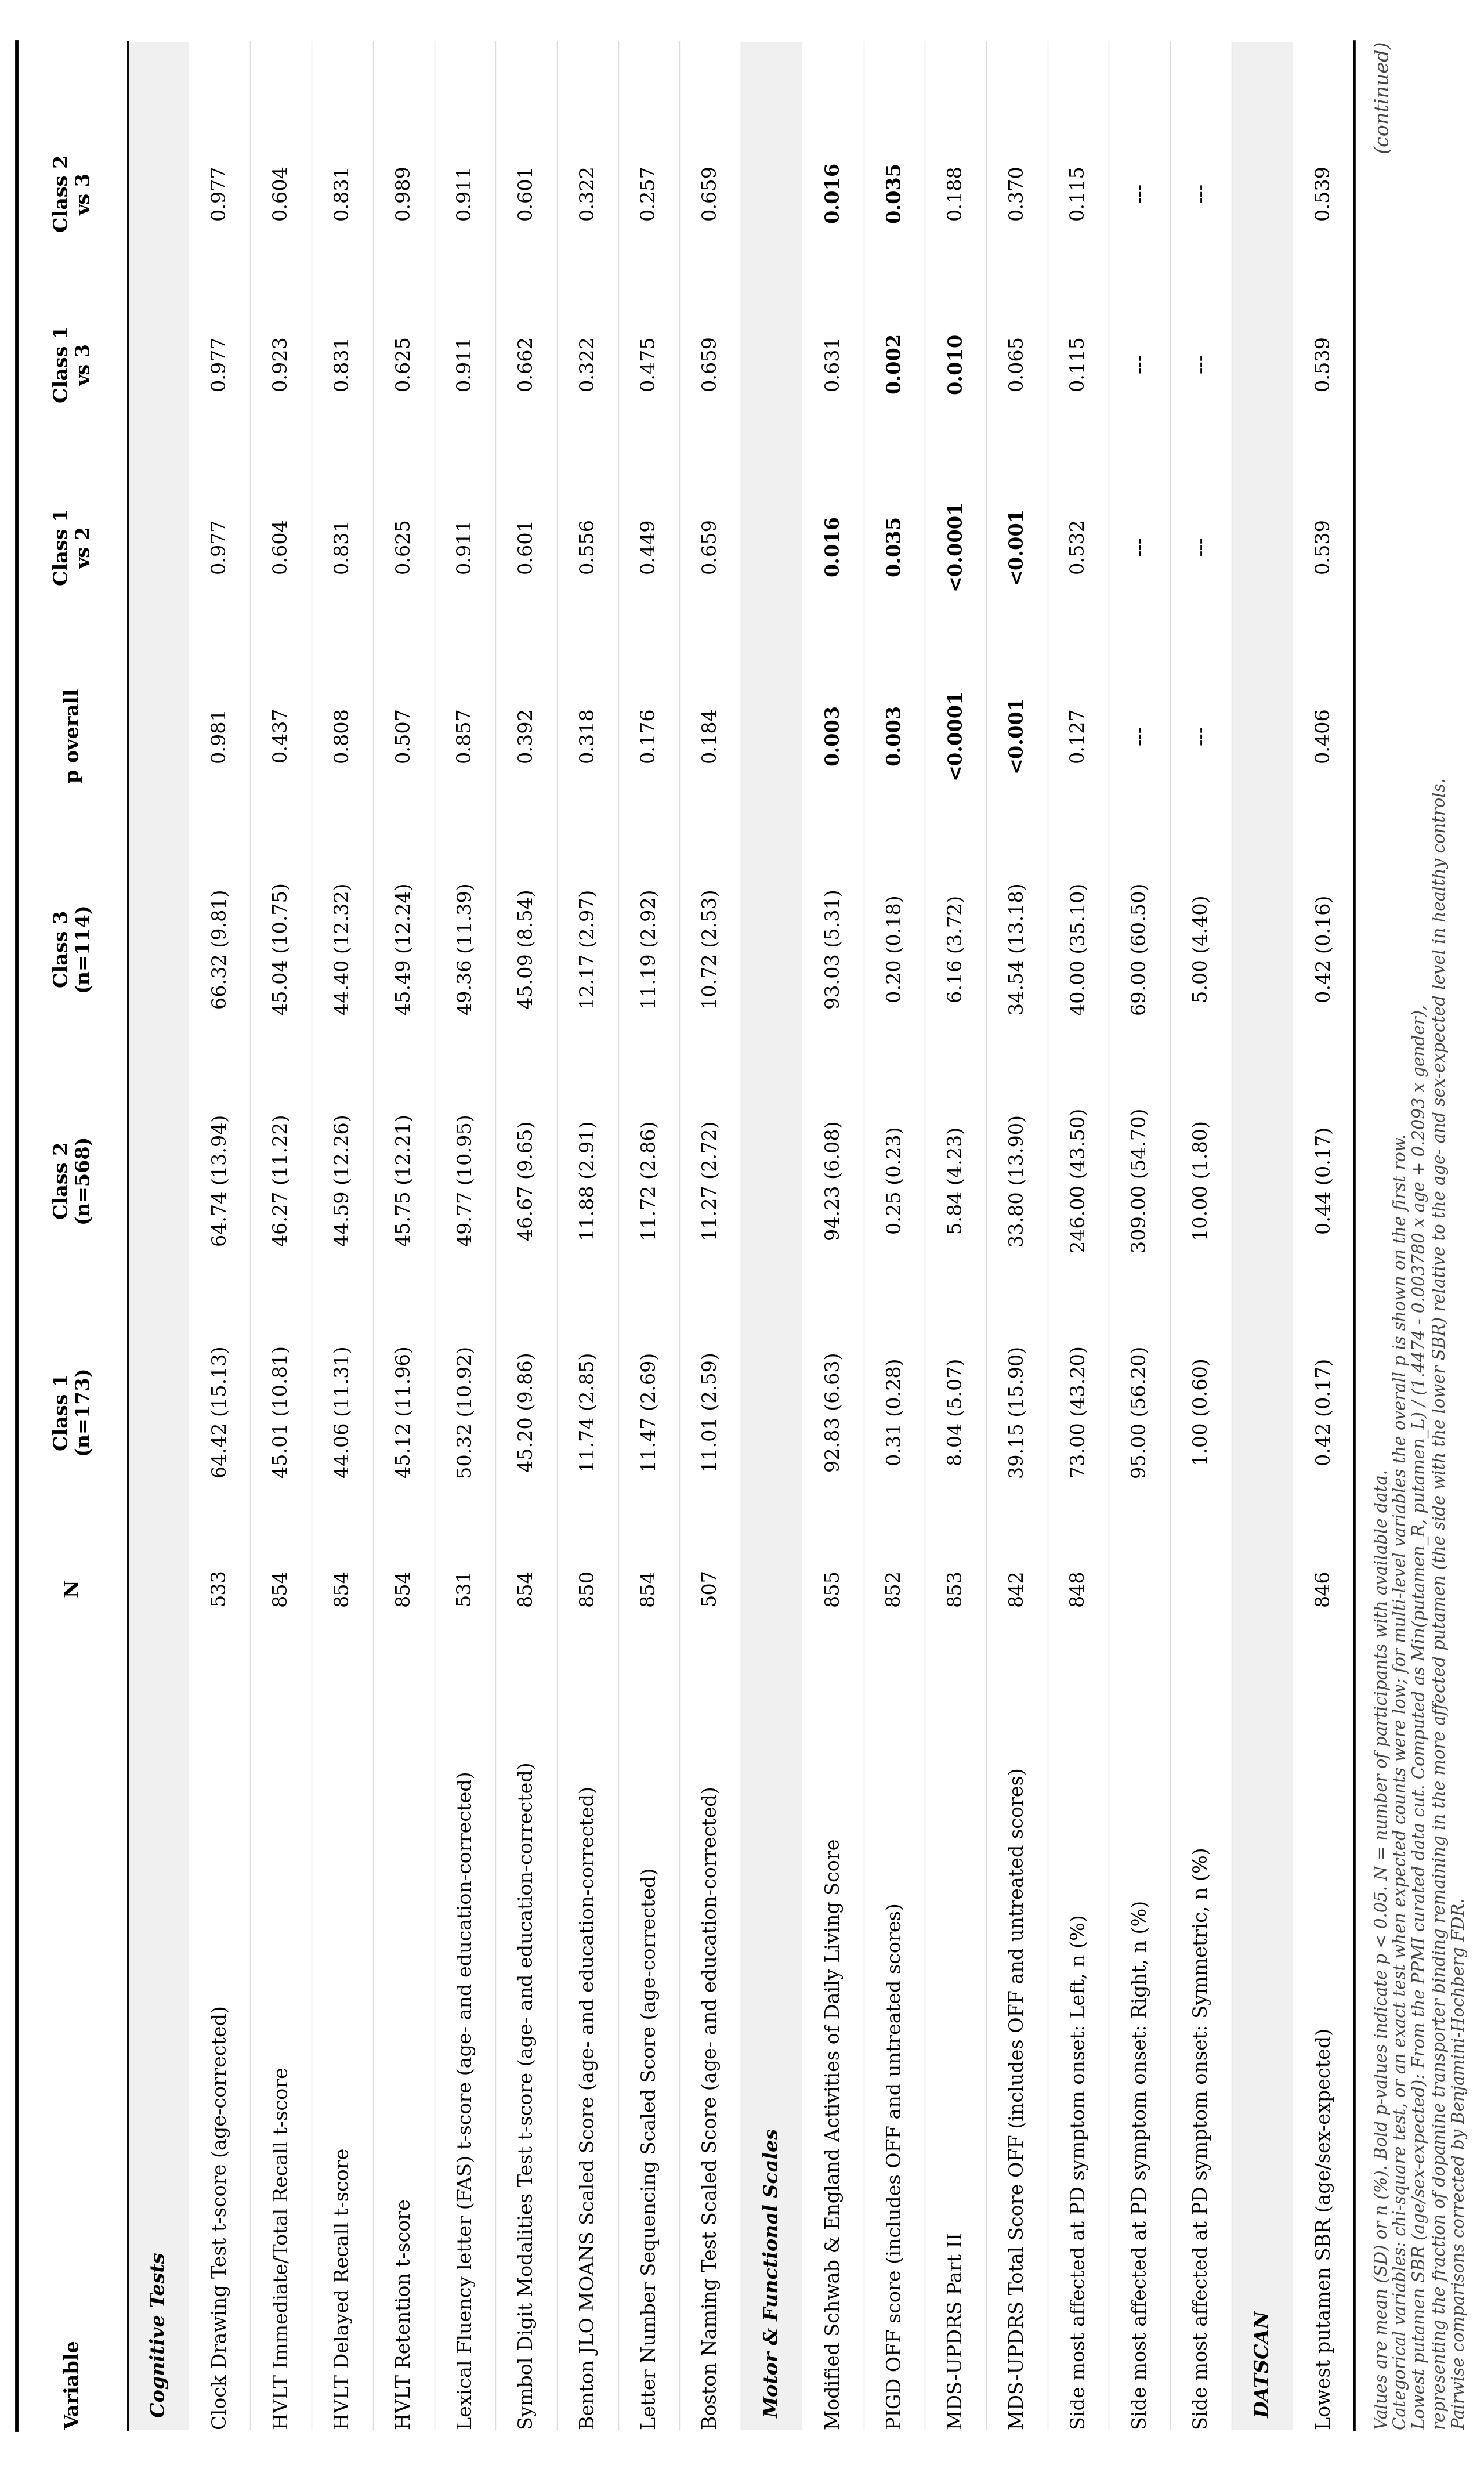
Baseline clinical characteristics showed that the three classes did not differ significantly in age at diagnosis or symptom onset, disease duration, education, Hoehn-Yahr stage, dominant side of symptom onset, motor severity (UPDRS Part III), global cognition (MoCA), or the battery of neuropsychological tests. Class 1 carried the heaviest overall disease burden, with the highest RBDSQ (8.65±1.83), SCOPA-AUT (14.33±7.49), STAI (66.69±18.46), GDS (2.78±2.58), ESS (6.42±3.83), QUIP (0.37±0.80), and MDS-UPDRS Part I (8.28±5.12), all significantly exceeding Class 2 (p < 0.05). Olfaction was impaired (UPSIT 20.33±7.76, p < 0.001 vs Class 2), and orthostatic blood pressure drop was elevated (ΔSBP 6.61±13.64, p = 0.006 vs Class 2), however these two features were most severe in Class 3. This group also had the greatest motor and functional impact, with the highest MDS-UPDRS Part II, PIGD score, lowest ADL score, and a marked male predominance (80.9% vs 61.4% in Class 2, p < 0.0001). Class 2 repesented the low-burden group, with overall mildest non-motor, motor and functional symptoms, serving as the reference against which the other two groups were defined.
Class 3 occupied an intermediate position overall, with a baseline profile that showed early signs of divergence from Class 2. Compared with Class 2, Class 3 had significantly worse olfactory function (UPSIT 19.85 ± 6.24, p < 0.001), higher autonomic burden (SCOPA-AUT 11.43 ± 6.43, p = 0.002), higher PIGD scores, lower ADL scores, and a greater male predominance (all p < 0.05). Although baseline RBDSQ was significantly higher than Class 2 (3.82 vs 2.77), it remained below the diagnostic cutoff. ΔSBP was numerically highest in Class 3 (6.82 ± 15.07) but did not differ significantly from Class 2. Compared with Class 1, Class 3 remained less globally impaired, with significantly lower RBDSQ, SCOPA-AUT, PIGD, and MDS-UPDRS Part I/II scores. Overall, Class 3 was characterized by selective early abnormalities, most notably hyposmia and autonomic dysfunction.
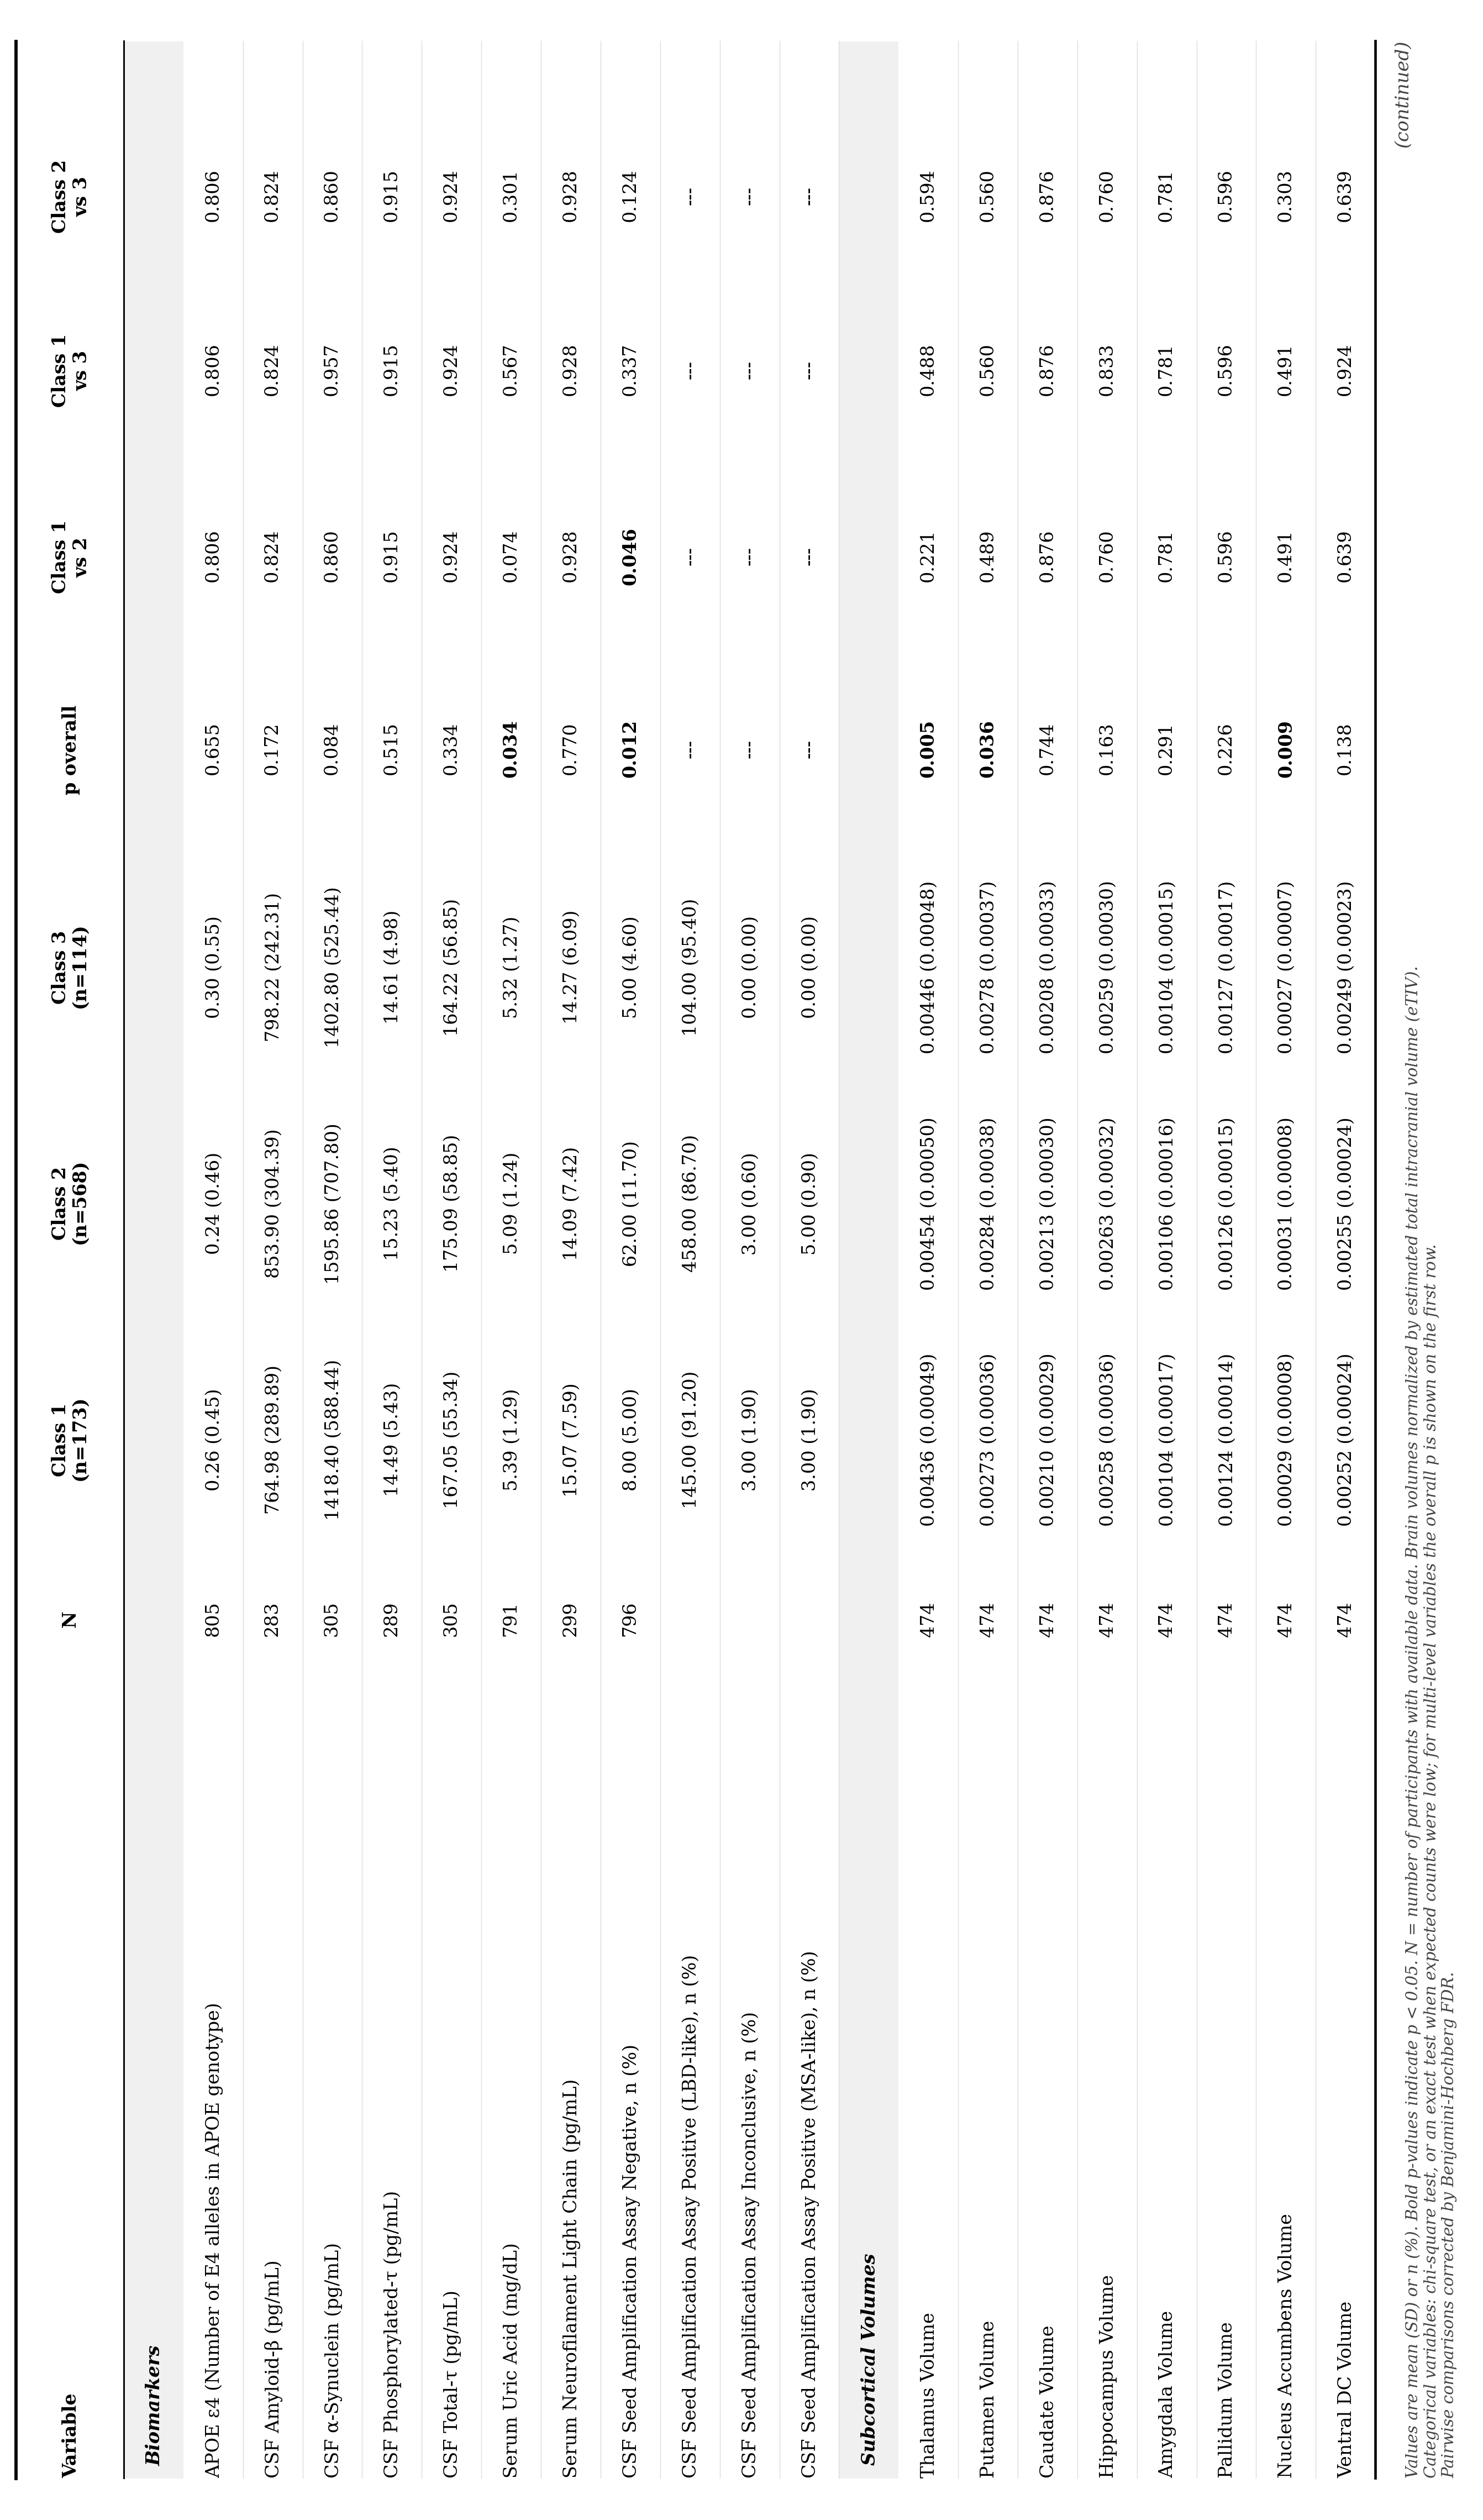
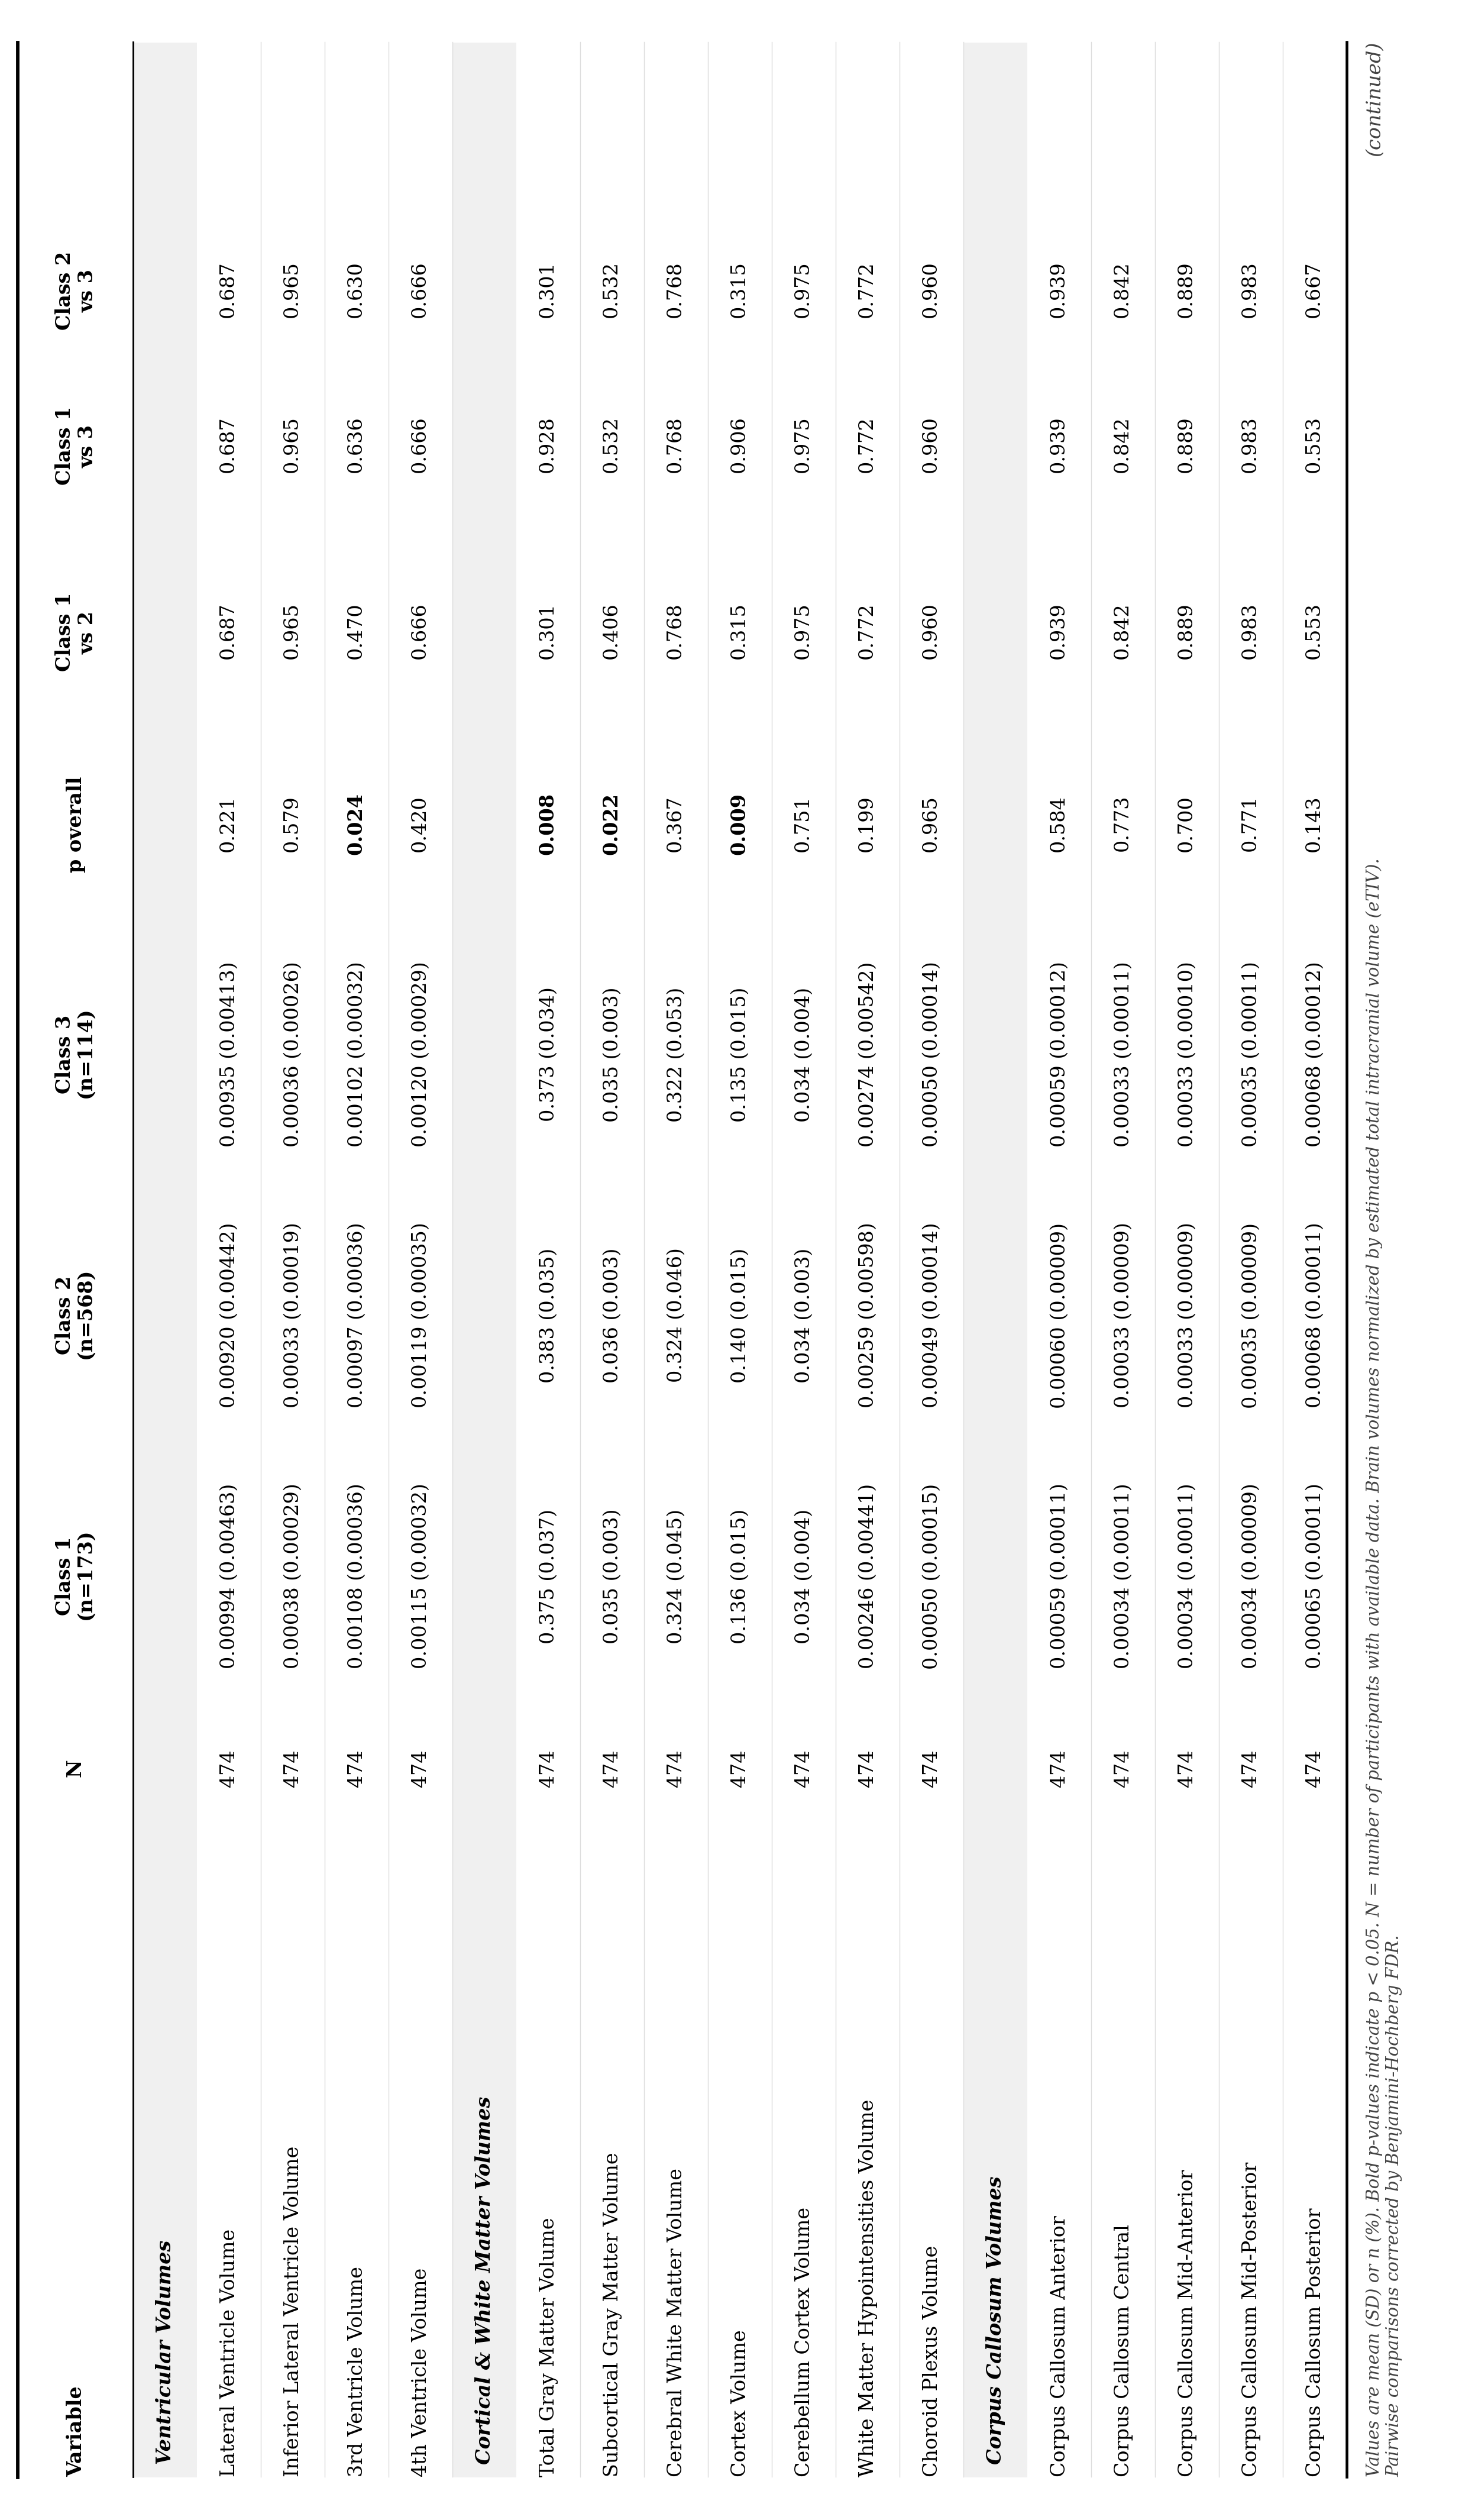
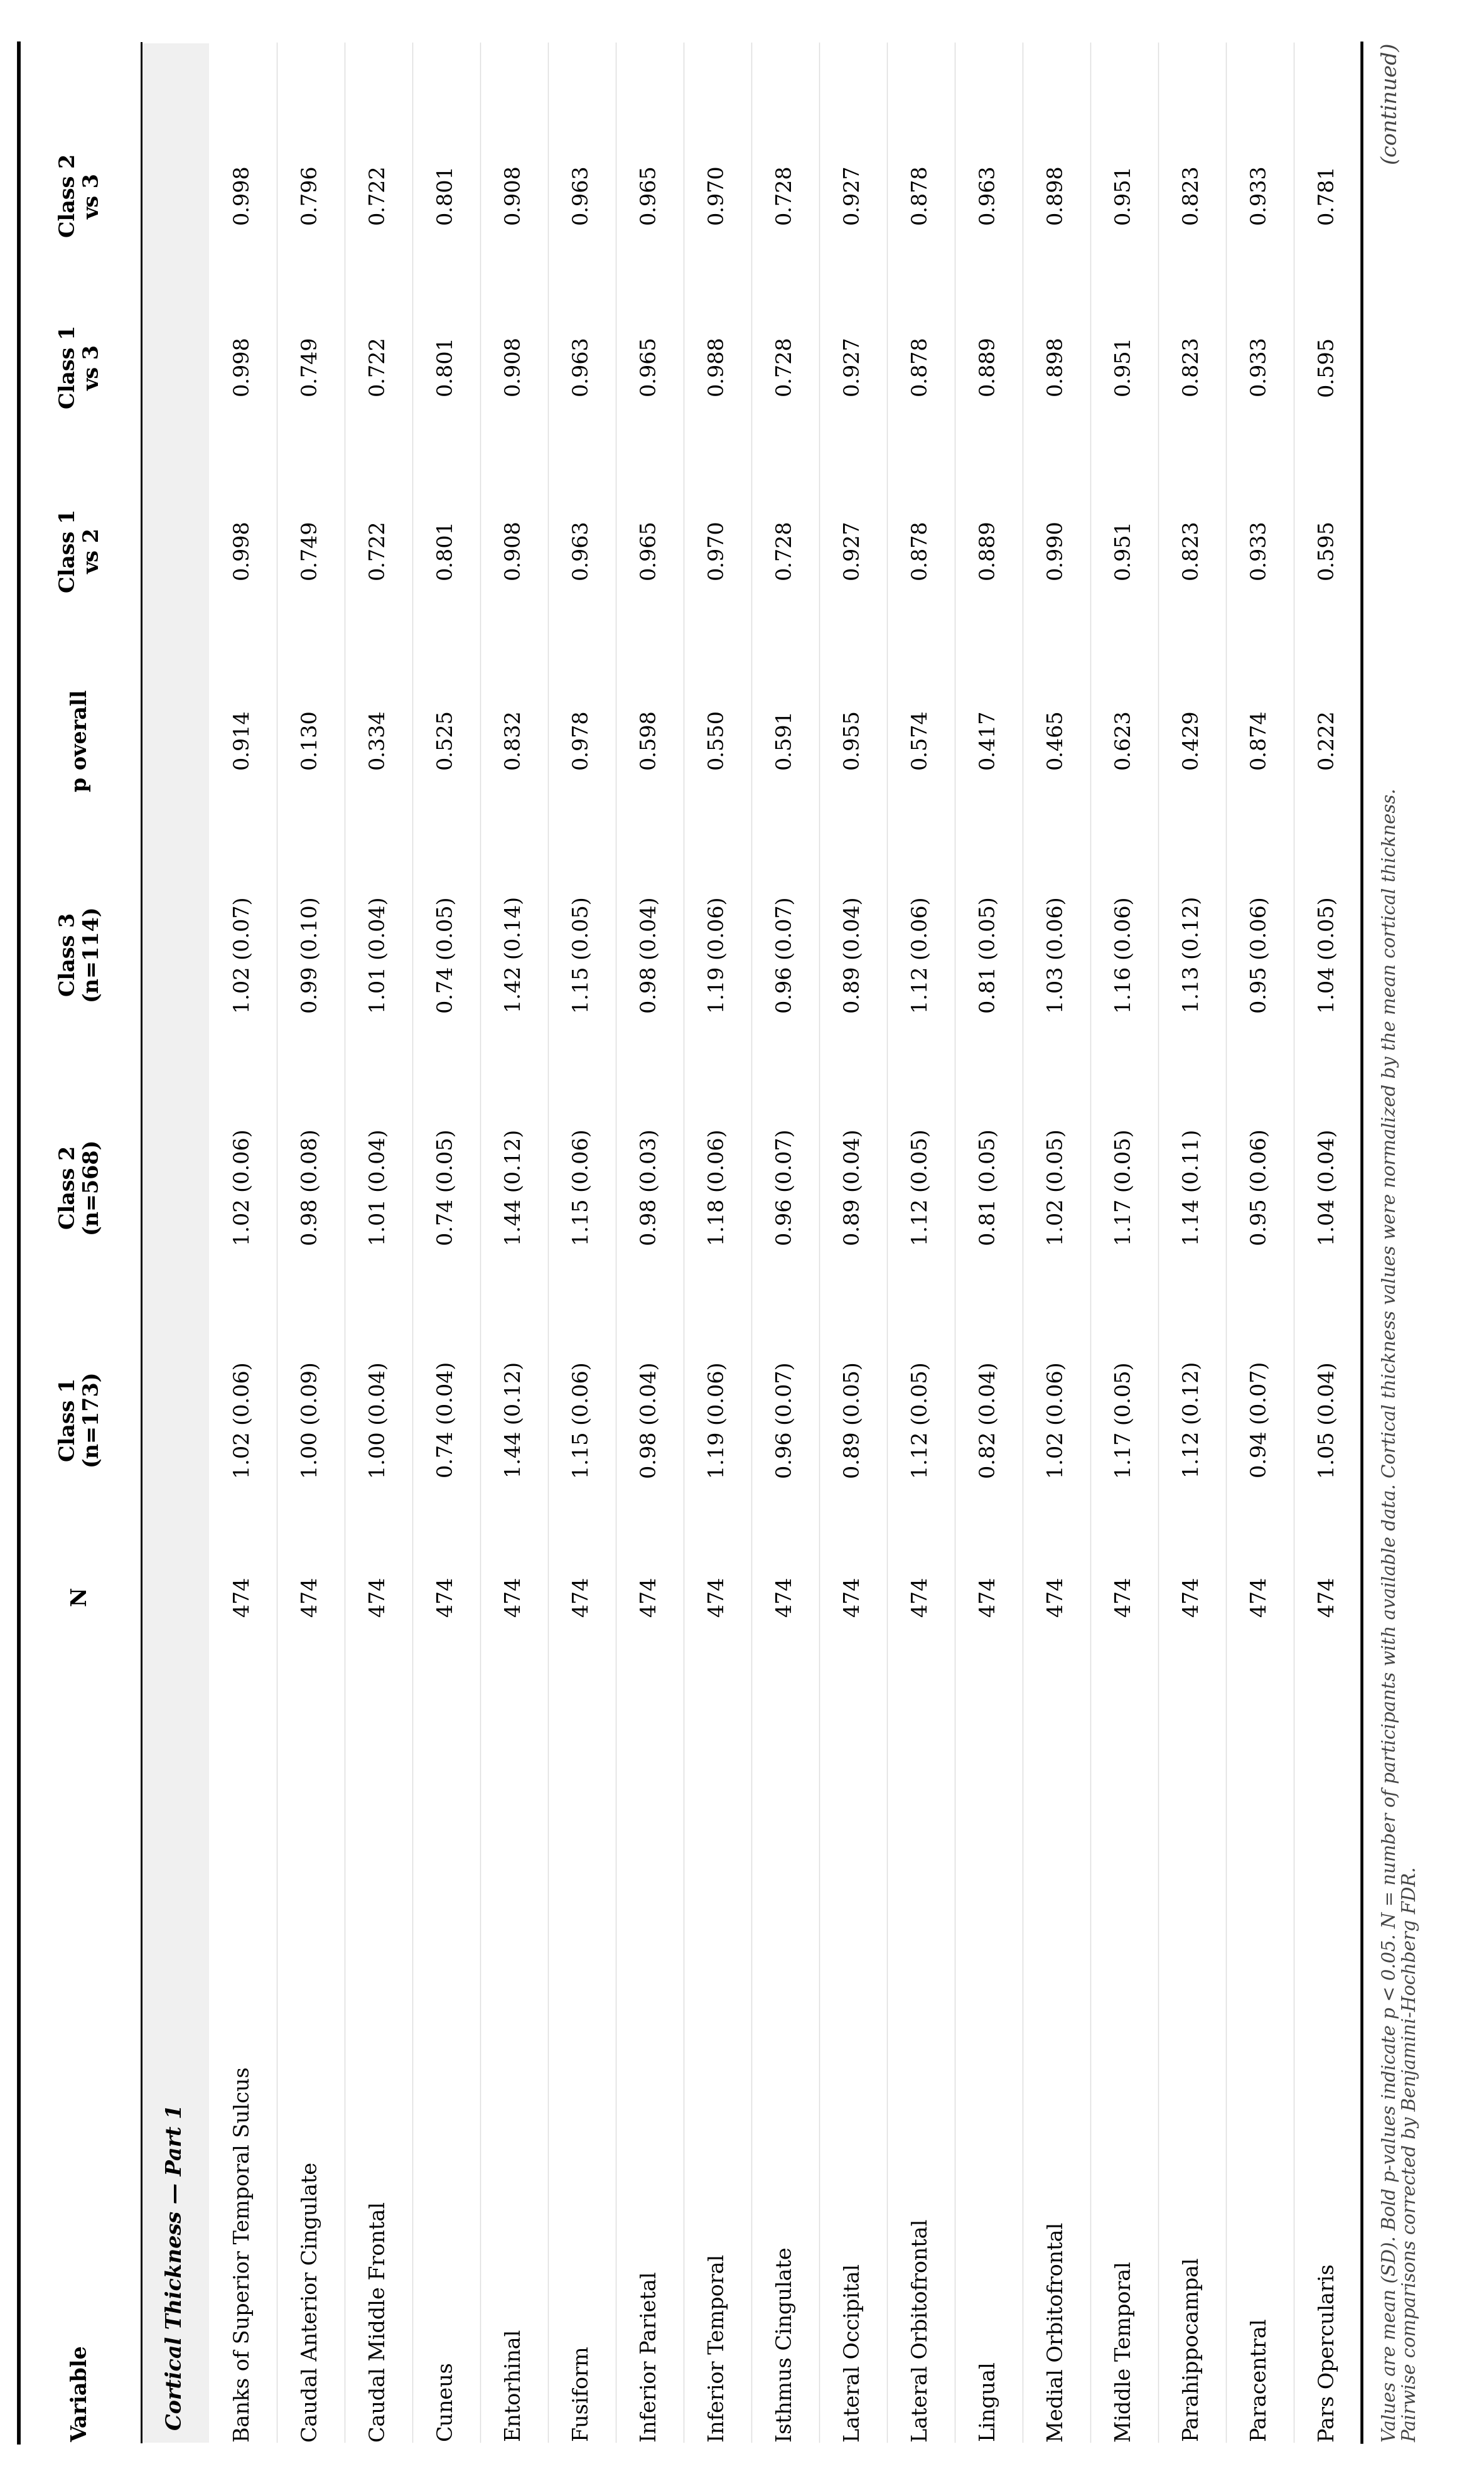
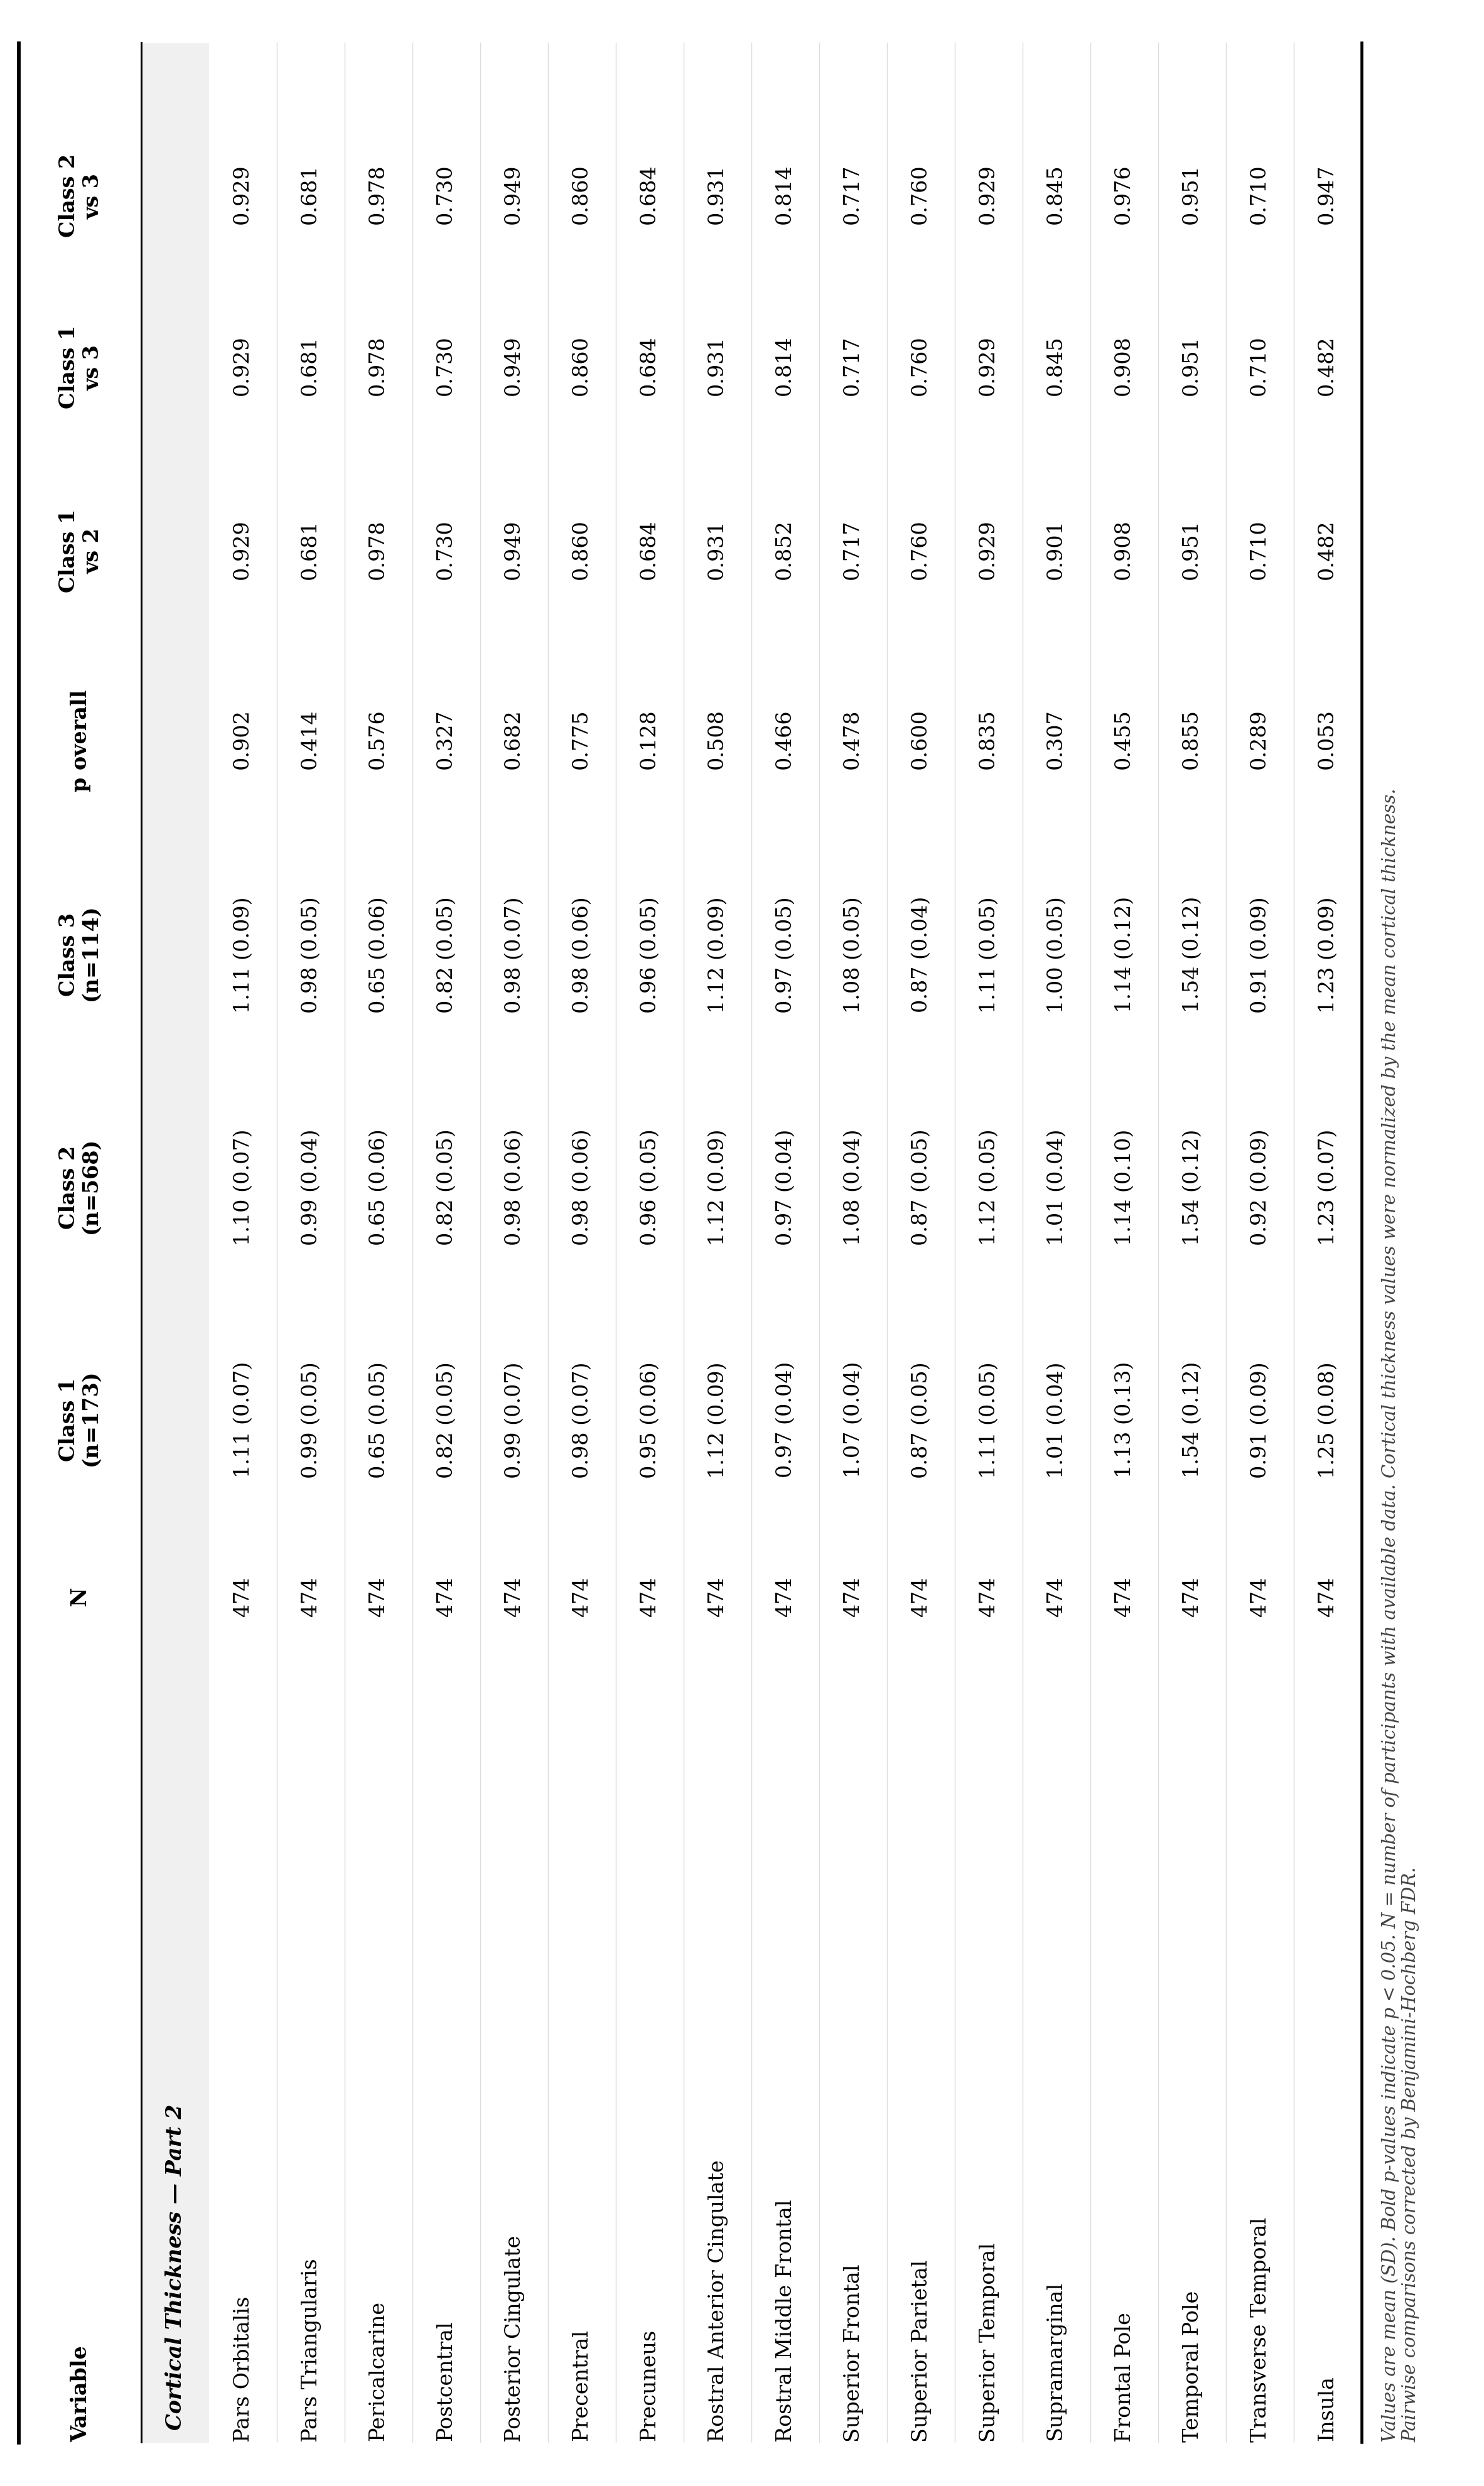
Baseline biomarker and neuroimaging profiles were largely comparable across classes. CSF Aβ, total α-synuclein, phosphorylated tau, total tau, serum NfL, and APOE ε4 burden showed no significant differences. Although serum urate differed modestly among classes (p = 0.034), with Class 2 showing the lowest levels, this class also had the lowest proportion of male participants, so the difference may partly reflect sex imbalance. Pairwise comparisons between classes were not statistically significant. CSF α-synuclein seed amplification assay (SAA) status differed among classes (overall p = 0.014), with Class 2 showing a higher proportion of SAA-negative cases (11.7%) than Classes 1 (5.0%) and 3 (4.6%). Age-/sex-expected lowest putamen ratio was similar across groups, indicating comparable baseline nigrostriatal dopaminergic deficits. MRI revealed several nominal overall differences, including thalamus (p = 0.005), putamen (p = 0.036), nucleus accumbens (p = 0.009), third ventricle (p = 0.024), total gray matter (p = 0.008), subcortical gray matter (p = 0.022), and cortex volume (p = 0.009), though pairwise comparisons did not survive FDR correction. Class 2 generally showed numerically larger brain volumes. Cortical thickness measures did not differ significantly across classes.
Detailed values for each variable are provided in the table below.
Acknowledgments
This work was supported by the Impact Scholars Program. We thank the PPMI participants and staff.
Data Availability
Published via Impact Scholars; original development repository.
- Sieber, B.-A., Landis, S., Koroshetz, W., Bateman, R., Siderowf, A., Galpern, W. R., Dunlop, J., Finkbeiner, S., Sutherland, M., Wang, H., Lee, V. M.-Y., Orr, H. T., Gwinn, K., Ludwig, K., Taylor, A., Torborg, C., & Montine, T. J. (2014). Prioritized Research Recommendations from the National Institute of Neurological Disorders and Stroke Parkinson’s Disease 2014 Conference. Annals of Neurology, 76(4), 469–472. 10.1002/ana.24261
- Marek, K., Chowdhury, S., Siderowf, A., Lasch, S., Coffey, C. S., Caspell‐Garcia, C., Simuni, T., Jennings, D., Tanner, C. M., Trojanowski, J. Q., Shaw, L. M., Seibyl, J., Schuff, N., Singleton, A., Kieburtz, K., Toga, A. W., Mollenhauer, B., Galasko, D., Chahine, L. M., … Sherer, T. (2018). The Parkinson’s Progression Markers Initiative (PPMI) – Establishing a PD Biomarker Cohort. Annals of Clinical and Translational Neurology, 5(12), 1460–1477. 10.1002/acn3.644
- Jankovic, J., McDermott, M., Carter, J., Gauthier, S., Goetz, C., Golbe, L., Huber, S., Koller, W., Olanow, C., & Shoulson, I. (1990). Variable Expression of Parkinson’s Disease: A Base-Line Analysis of the DATATOP Cohort. The Parkinson Study Group. Neurology, 40(10), 1529–1534. 10.1212/wnl.40.10.1529
- Sauerbier, A., Jenner, P., Todorova, A., & Chaudhuri, K. R. (2016). Non Motor Subtypes and Parkinson’s Disease. Parkinsonism & Related Disorders, 22, S41–S46. 10.1016/j.parkreldis.2015.09.027
- Fereshtehnejad, S.-M., Romenets, S. R., Anang, J. B. M., Latreille, V., Gagnon, J.-F., & Postuma, R. B. (2015). New Clinical Subtypes of Parkinson Disease and Their Longitudinal Progression: A Prospective Cohort Comparison With Other Phenotypes. JAMA Neurology, 72(8), 863–873. 10.1001/jamaneurol.2015.0703
- Fereshtehnejad, S.-M., Zeighami, Y., Dagher, A., & Postuma, R. B. (2017). Clinical Criteria for Subtyping Parkinson’s Disease: Biomarkers and Longitudinal Progression. Brain: A Journal of Neurology, 140(7), 1959–1976. 10.1093/brain/awx118
- Velucci, V., Iliceto, G., Vitucci, B., Idrissi, S., Milella, G., Mascia, M. M., Muroni, A., & Defazio, G. (2025). Non-Motor Symptom Subtypes in Early Parkinson’s Disease. Parkinsonism & Related Disorders, 140, 107982. 10.1016/j.parkreldis.2025.107982
- Markello, R. D., Shafiei, G., Tremblay, C., Postuma, R. B., Dagher, A., & Misic, B. (2021). Multimodal Phenotypic Axes of Parkinson’s Disease. Npj Parkinson’s Disease, 7(1), 6. 10.1038/s41531-020-00144-9
- Faghri, F., Hashemi, S. H., Leonard, H., Scholz, S. W., Campbell, R. H., Nalls, M. A., & Singleton, A. B. (2018, June 5). Predicting Onset, Progression, and Clinical Subtypes of Parkinson Disease Using Machine Learning. 10.1101/338913
- Pourzinal, D., Lawson, R. A., Yarnall, A. J., Williams-Gray, C. H., Barker, R. A., Yang, J., McMahon, K. L., O’Sullivan, J. D., Byrne, G. J., & Dissanayaka, N. N. (2024). Profiling People with Parkinson’s Disease at Risk of Cognitive Decline: Insights from PPMI and ICICLE-PD Data. Alzheimer’s & Dementia, 16(3), e12625. 10.1002/dad2.12625
- Chen, K., Du, K., Zhao, Y., Gu, Y., & Zhao, Y. (2021). Trajectory Analysis of Orthostatic Hypotension in Parkinson’s Disease: Results From Parkinson’s Progression Markers Initiative Cohort. Frontiers in Aging Neuroscience, 13. 10.3389/fnagi.2021.762759
- He, P., Gao, Y., Shi, L., Li, Y., Jiang, S., Tie, Z., Qiu, Y., Ma, G., Zhang, Y., Nie, K., & Wang, L. (2023). Motor Progression Phenotypes in Early-Stage Parkinson’s Disease: A Clinical Prediction Model and the Role of Glymphatic System Imaging Biomarkers. Neuroscience Letters, 814, 137435. 10.1016/j.neulet.2023.137435
- Zeighami, Y., Ulla, M., Iturria-Medina, Y., Dadar, M., Zhang, Y., Larcher, K. M.-H., Fonov, V., Evans, A. C., Collins, D. L., & Dagher, A. (2015). Network Structure of Brain Atrophy in de Novo Parkinson’s Disease. eLife, 4, e08440. 10.7554/eLife.08440
- Filidei, M., Marsili, L., & Colosimo, C. (2025). Do Parkinson’s Disease Clinical Subtypes Really Exist? Neurologia I Neurochirurgia Polska, 59(2), 127–143. 10.5603/pjnns.103572
- Sun, Y., Na, H. K., Yoon, S. H., Vo, Q. P., Park, C. W., Lee, J. H., Choi, Y. Y., Yoo, H. S., Sohn, Y. H., Lyoo, C. H., & Lee, P. H. (2025). Olfactory Dysfunction as a Window Into the Heterogeneity of Parkinson Disease. European Journal of Neurology, 32(11), e70404. 10.1111/ene.70404