Characterization of large-scale brain connectivity patterns associated with depression in Parkinson’s disease
Abstract
Depression is a prevalent and disabling non-motor symptom of Parkinson’s disease (PD), substantially contributing to cognitive decline and reduced quality of life. Resting-state functional MRI (rs-fMRI) provides a non-invasive approach to investigate large-scale network alterations associated with psychiatric manifestations in PD. In this study, we investigated whether resting-state connectivity patterns could serve as candidate markers of depression in PD using data from 90 participants from the Parkinson’s Progression Markers Initiative (PPMI). Connectivity was assessed using complementary seed-based connectivity (SBC), ROI-to-ROI functional connectivity, and graph-theoretical analyses across 15 regions spanning the default mode (DMN), salience (SN), and frontoparietal (FPN) networks. SBC analysis revealed significant connectivity differences between PD patients with depression (PDD) and without depression (PDND), identifying alterations involving the medial prefrontal cortex (mPFC), dorsal anterior cingulate cortex (dACC), superior parietal lobule (SPL), and supramarginal gyrus (SMG). ROI-based functional connectivity further identified convergent alterations within mPFC-centered DMN connectivity, showing negative associations between depressive symptom severity and functional connectivity measures. Based on these convergent findings, a composite DMN connectivity score was constructed, revealing a progressive decrease in connectivity across groups and significant differences between PDD and controls. Collectively, these findings highlight mPFC-centered DMN connectivity as a potential marker associated with depression in Parkinson’s disease.
Introduction
Depression is a prevalent and disabling non-motor symptom of Parkinson’s disease (PD), affecting up to 50% of patients and exacerbating motor and cognitive decline. Its multifactorial etiology involves demographic, clinical, and neurocognitive factors Cong et al., 2022; however, the underlying neural mechanisms remain poorly understood. While motor network dysfunction in PD has been extensively characterized, depression-related connectivity alterations, particularly within the default mode and limbic networks Morgan et al., 2018, Xu et al., 2022, remain heterogeneous. Given this heterogeneity, we focused on large-scale resting-state networks most consistently implicated in depression, particularly the default mode network (DMN), because the DMN supports self-referential and affective processing and contains hubs, notably the medial prefrontal cortex (mPFC), that show reproducible connectivity alterations in major depression Zheng et al., 2026Zhang et al., 2024Sheline et al., 2009.
This study investigates resting-state connectivity as a potential marker of depression in PD using Parkinson’s Progression Markers Initiative (PPMI) data. We analyzed rs-fMRI, T1-weighted imaging, and Geriatric Depression Scale (GDS) scores from 90 participants. Functional connectivity was evaluated through seed-based and ROI-to-ROI approaches focusing on 15 regions spanning the default mode (DMN), salience (SN), and frontoparietal (FPN) networks, given their reported involvement in depression and PD. In addition, graph-theoretical analysis was employed to characterize alterations in large-scale network organization, including global integration and local segregation.
We hypothesized that depression in PD would be associated with altered large-scale network organization, particularly within the DMN, and that medial prefrontal cortex (mPFC)-centered connectivity alterations would emerge as a potential marker associated with depressive symptom severity.
Methods
Data & Participants
A total of 90 participants from the PPMI dataset, supported by the Michael J. Fox Foundation for Parkinson’s Research Marek et al., 2011, were categorized into Healthy Controls (CTRL), Parkinson’s Disease without Depression (PDND), and Parkinson’s Disease with Depression (PDD), using a Geriatric Depression Scale (GDS) threshold of for the PDD group. Data included 3T rs-fMRI, T1-weighted images, demographics, and clinical metrics. To address scanner heterogeneity, we used a harmonization procedure (see Supplementary Material). Acquisition parameters were consistent across sites (TR = 2.5 s, 240 volumes), with comprehensive characteristics detailed in Table 1 and Table 2.
Table 1:Participant characteristics across groups
| Group | N | Age (mean ± SD) | Sex (M/F) | GDS (mean ± SD) |
|---|---|---|---|---|
| CTRL | 32 | 65.67 ± 12.37 | 18/14 | – |
| PDND | 32 | 64.06 ± 10.52 | 19/13 | 1.03 ± 1.31 |
| PDD | 26 | 62.91 ± 9.73 | 18/8 | 6.88 ± 2.29 |
Table 2:Distribution of participants across MRI scanner manufacturers
| Group | Siemens | Philips | GE Medical |
|---|---|---|---|
| CTRL | 24 | 4 | 4 |
| PDND | 24 | 4 | 4 |
| PDD | 18 | 4 | 4 |
Preprocessing & ROI Definition
Functional and anatomical MRI data were preprocessed using the default preprocessing pipeline implemented in the CONN toolbox (CONNv25.b; Nieto-Castanon & Whitfield-Gabrieli, 2022), which is widely used in functional connectivity studies. Detailed preprocessing steps are provided in the Supplementary Material.
Following preprocessing, 15 regions of interest (ROIs) spanning the Default Mode Network (DMN), Salience Network (SN), and Frontoparietal Network (FPN) were selected from the CONN network atlas (Table 3). These networks were chosen based on their reported involvement in cognitive and emotional processing and their relevance to non-motor symptoms in Parkinson’s disease Menon, 2011Liao et al., 2021.
Table 3:CONN toolbox network region of interest (ROI) definitions. Coordinates are reported in Montreal Neurological Institute (MNI) space. L = left hemisphere; R = right hemisphere.
| Network | Seed | x | y | z |
|---|---|---|---|---|
| Salience network (SAL) | Mid-cingulate cortex | 0 | 22 | 35 |
| Salience network (SAL) | Anterior insula (L) | -44 | 13 | 1 |
| Salience network (SAL) | Anterior insula (R) | 47 | 14 | 0 |
| Salience network (SAL) | Rostral prefrontal cortex (L) | -35 | 45 | 27 |
| Salience network (SAL) | Rostral prefrontal cortex (R) | 32 | 46 | 27 |
| Salience network (SAL) | Supramarginal gyrus (L) | -60 | -39 | 31 |
| Salience network (SAL) | Supramarginal gyrus (R) | 62 | -35 | 32 |
| FrontoParietal network (FPN) | Lateral prefrontal cortex (L) | -43 | 33 | 28 |
| FrontoParietal network (FPN) | Posterior parietal cortex (L) | -46 | -58 | 49 |
| FrontoParietal network (FPN) | Lateral prefrontal cortex (R) | 41 | 38 | 30 |
| FrontoParietal network (FPN) | Posterior parietal cortex (R) | 52 | -52 | 45 |
| Default mode network (DMN) | Medial prefrontal cortex | 1 | 55 | -3 |
| Default mode network (DMN) | Lateral parietal cortex (L) | -39 | -77 | 33 |
| Default mode network (DMN) | Lateral parietal cortex (R) | 47 | -67 | 29 |
| Default mode network (DMN) | Posterior cingulate cortex | 1 | -61 | 38 |
Connectivity Analyses
Connectivity analyses were performed in two stages. An initial seed-based connectivity (SBC) analysis was conducted in a homogeneous subset of participants acquired using the same scanner manufacturer (16 PDD, 20 PDND) to identify connectivity differences across groups. Subsequently, the study was extended to a larger multicenter cohort (N = 90, Table 2) using ComBat harmonization (see Supplementary Material), where ROI-based functional connectivity and graph analyses were performed to evaluate whether connectivity alterations were associated with depressive symptom severity (GDS).
Seed-Based Connectivity Analysis
First-level seed-based connectivity maps were generated from the 15 predefined network ROIs using bivariate correlations within the CONN toolbox (CONNv25.b Nieto-Castanon & Whitfield-Gabrieli, 2022), followed by Fisher-Z transformation. At the second level, group-level connectivity differences were evaluated using the model:
where SBC represents seed-based connectivity strength and Control, PDND, and PDD serve as indicator variables for each diagnostic category, while Outliers accounts for the quality assurance covariate of excluded subjects. Differences across seeds were assessed using a multivariate omnibus F-test. Statistical significance was defined at voxel-level and cluster-level FDR correction () based on Gaussian Random Field theory. Detailed preprocessing steps are provided in the Supplementary Material.
Functional Connectivity Analysis
ROI-based functional connectivity matrices were estimated using Pearson correlations between the predefined network ROIs and Fisher-Z transformed prior to harmonization. Associations between connectivity and depressive symptom severity were evaluated using generalized linear models implemented in Python (Statsmodels):
where FC represents ROI-to-ROI functional connectivity values and GDS denotes depressive symptom severity. Multiple comparisons were controlled using FDR correction (). Graph-theoretical measures were subsequently derived from the harmonized connectivity matrices.
Graph-Theoretical Analysis
Subject-level weighted connectivity matrices served as inputs to construct undirected weighted graphs across the 15 ROIs. They were converted to absolute weighted matrices, and diagonal elements were set to zero. Following standard graph theory approaches bullmore_complex_2009, Rubinov & Sporns, 2010 and using BCTpy-0.6.1 (Brain Connectivity Toolbox), graphs were thresholded across densities from 0.10 to 0.30 in steps of 0.05, and area under the curve (AUC) values were computed across densities for all metrics. The analysis included global metrics, including weighted strength, clustering coefficient, global efficiency, and betweenness centrality, as well as local metrics, including nodal strength, clustering coefficient, betweenness centrality, participation coefficient, and within-module strength z-score to characterize regional connectivity patterns Sporns, 2018. Group comparisons were performed using Mann–Whitney U tests with FDR correction.
Results and Discussion
Figure 1 summarizes the main findings.
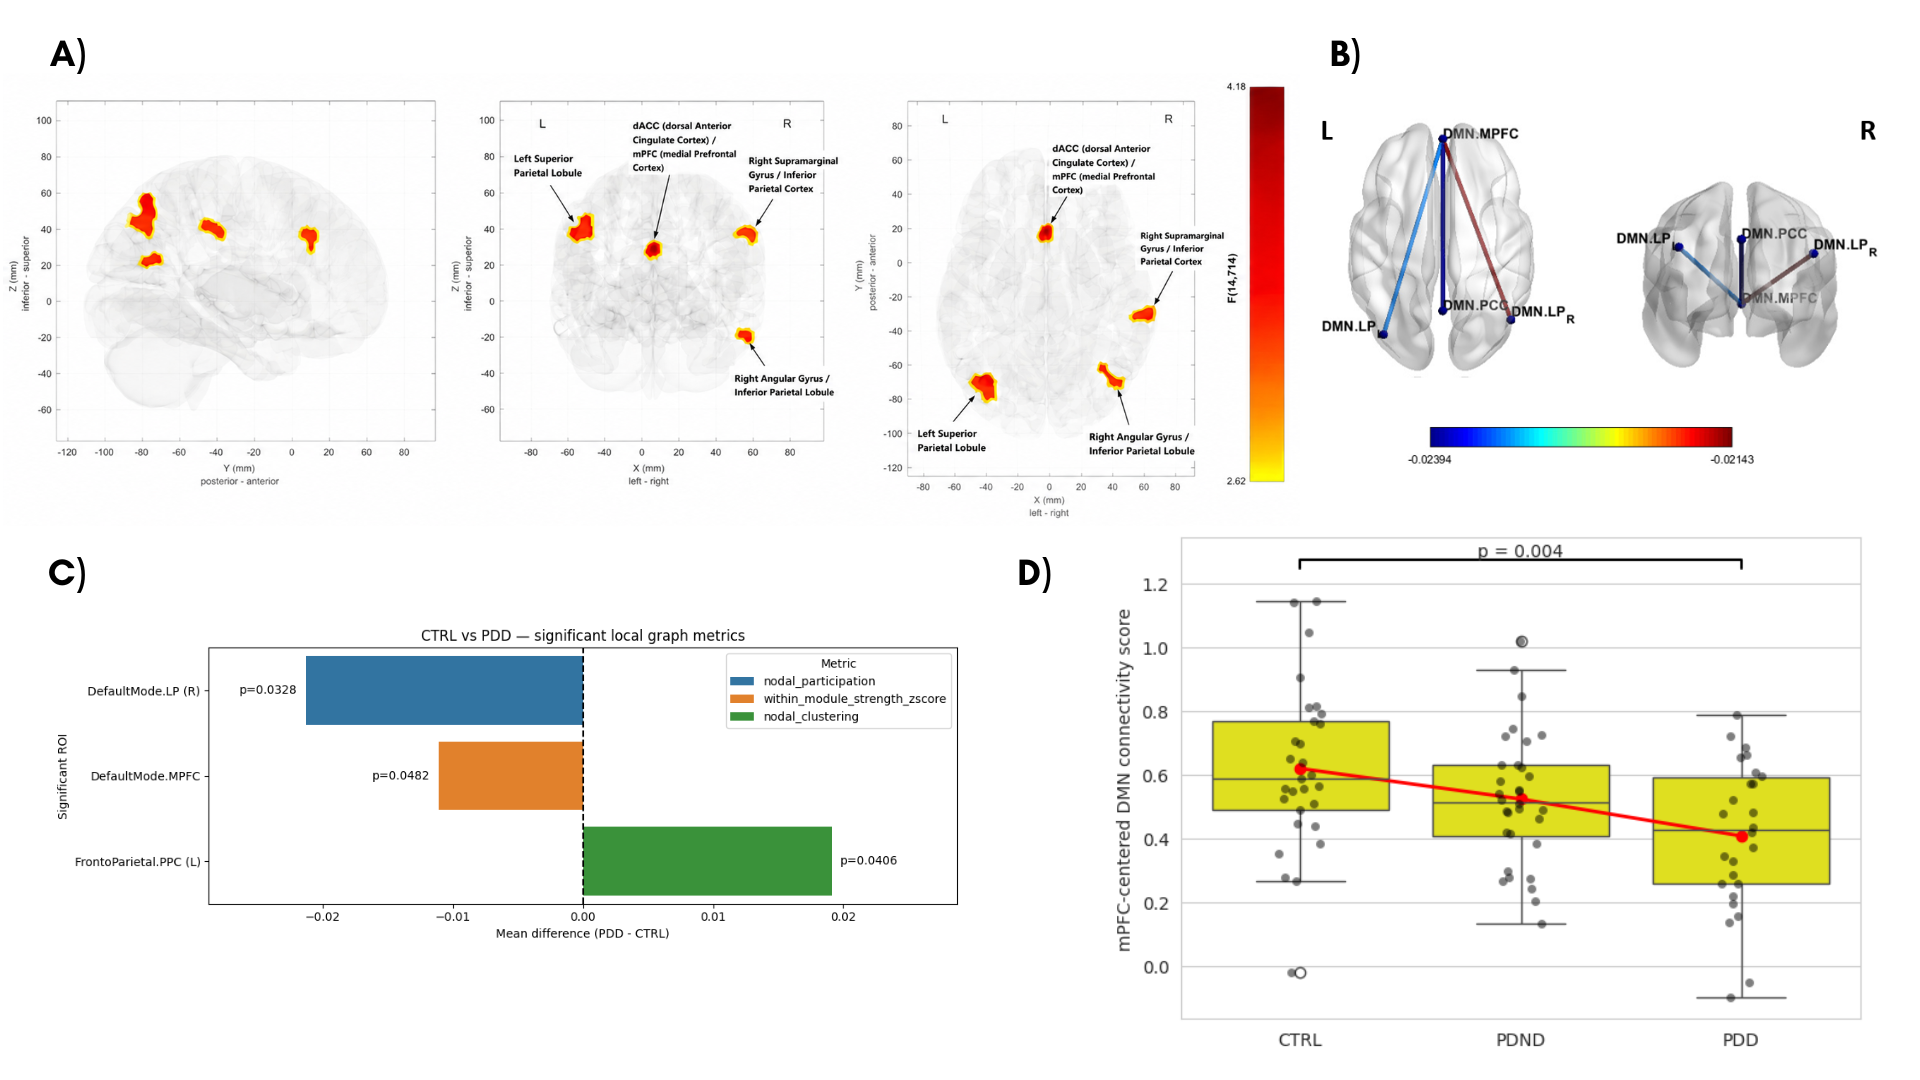
Figure 1:Overview of mPFC-centered connectivity analyses
A. Seed-based connectivity results showing significant clusters associated with mPFC connectivity alterations. Labeled regions indicate significant clusters located in the Left Superior Parietal Lobule (SPL), dorsal Anterior Cingulate Cortex (dACC) / medial Prefrontal Cortex (mPFC), and Right Supramarginal Gyrus / Inferior Parietal Cortex. Spatial coordinates are reported in millimeters along the X, Y, and Z axes. The color bar represents F-values (F(14, 714)) ranging from 2.62 to 4.18.
B. ROI-to-ROI DMN connectivity patterns centered on the mPFC. Line colors represent GLM beta values, showing negative associations between functional connectivity and group progression. For visualization purposes, connection thickness was kept uniform across edges.
C. Nodal level Graph theory analysis results showing significant ROIs and their mean difference between CTRL and PDD groups based on Nodal Clustering, Nodal Participation and Within Module Strength z-score.
D. Distribution of DMN connectivity scores across CTRL, PD, and PDD groups. Red lines indicate
group means, highlighting a progressive decrease in mPFC-centered DMN connectivity across groups.
Seed-based connectivity analysis revealed significant group-level differences between PDD and PDND, identifying four clusters of altered connectivity involving the left superior parietal lobule (SPL), medial prefrontal cortex (mPFC)/dorsal anterior cingulate cortex (dACC), right middle temporal gyrus (MTG), and right supramarginal gyrus (SMG) (Figure 1; Table 4). The primary cluster was located in the left intraparietal sulcus (IPS)/SPL (cluster size , ), while the remaining clusters involved mPFC/dACC (), MTG (), and SMG (; all ). These findings suggest altered large-scale connectivity involving the DMN, salience, and frontoparietal networks in PDD. Altered mPFC/dACC connectivity, regions implicated in self-referential and emotional processing Levorsen et al., 2025Yun et al., 2022, may reflect depression-related network alterations previously reported in Parkinsonian populations Su et al., 2022Liao et al., 2021. Altered IPS and SMG connectivity may further indicate frontoparietal reorganization associated with disrupted basal ganglia-thalamocortical circuitry Liu et al., 2022.
ROI-based functional connectivity analysis identified convergent alterations within key DMN connections, including mPFC–left LP, mPFC–right LP, and mPFC–PCC (Figure 1; Table 5). All associations showed negative beta coefficients, indicating reduced DMN connectivity with increasing depressive symptom severity (GDS). Although these findings did not survive multiple comparison correction, they were further explored due to their consistency with previous studies reporting reduced DMN connectivity in major depressive disorder and recurrent depression Tozzi et al., 2021Yan et al., 2019Yuan et al., 2011.
Graph-based analysis provided a complementary evaluation of network topology across DMN, SN, and FPN. None of the global metrics showed significance; however, exploratory nodal effects were observed in the left frontoparietal posterior parietal cortex, right DMN lateral parietal cortex, and DMN mPFC (Table 6), indicating possible alterations in cross-network participation, local segregation, and within-module integration. Although these effects did not survive FDR correction, their regional distribution aligns with previous findings demonstrating a relationship between DMN and FPN alterations and depressive symptoms in PD, as well as altered FPN modular organization in depression Lan et al., 2022Wei et al., 2017.
Based on the convergent SBC, ROI-based, and graph-theoretical findings centered on the mPFC, a composite DMN connectivity score was constructed to further explore DMN alterations associated with depressive symptoms. Significant group differences () were observed between PDD and control subjects, showing a progressive decrease in DMN connectivity across groups (Figure 1; Table 7). These findings suggest that mPFC-centered DMN connectivity may represent a potential marker associated with depression in Parkinson’s disease, consistent with the established role of the mPFC in emotional processing and stress-related responses Pizzagalli & Roberts, 2022Bittar & Labonté, 2021.
Table 4:Significant clusters from seed-based connectivity analysis
| Cluster (MNI coord) | Size (k) | ||
|---|---|---|---|
| −36 −66 +54 | 209 | 0.000040 | 0.001890 |
| −02 +26 +32 | 101 | 0.001964 | 0.028392 |
| +36 −60 +18 | 97 | 0.002317 | 0.028392 |
| +66 −32 +40 | 96 | 0.002416 | 0.028392 |
Table 5:Uncorrected mPFC-centered functional connectivity findings
| ROI (coord) | |||
|---|---|---|---|
| DMN.MPFC → DMN.LP (L) | -0.023332 | 0.011707 | 0.892914 |
| DMN.MPFC → DMN.LP (R) | -0.021428 | 0.033765 | 0.892914 |
| DMN.MPFC → DMN.PCC | -0.023941 | 0.036295 | 0.892914 |
Table 6:Uncorrected graph-theoretical findings
| Metric | ROI (coord) | Effect Size | ||
|---|---|---|---|---|
| Nodal participation | DMN.LP (R) | -0.021308 | 0.032826 | 0.492393 |
| Nodal clustering | FPN.PPC (L) | 0.019115 | 0.040591 | 0.522919 |
| Within-module strength z-score | DMN.MPFC | -0.011111 | 0.048238 | 0.723570 |
Table 7:Group comparison of mPFC-centered DMN connectivity scores
| Comparison | Test | |
|---|---|---|
| Global | Kruskal–Wallis | 0.0108 |
| CTRL vs PDD | Post-hoc | 0.0043 |
| CTRL vs PDND | Post-hoc | 0.0897 |
| PDND vs PDD | Post-hoc | 0.1023 |
Conclusion
Seed-based analysis revealed significant functional connectivity differences between PDD and PDND within DMN and frontoparietal regions in a homogeneous Siemens cohort. Extending this analysis to a larger multicenter cohort through harmonization revealed convergent trends in mPFC-centered DMN connectivity, demonstrating a negative association between depressive symptom severity (GDS) and connectivity measures. Graph-theoretical analysis supported this pattern at the regional level, showing exploratory nodal alterations in DMN and frontoparietal regions without corrected global topology differences. Furthermore, exploration using a composite DMN connectivity score demonstrated a progressive decrease in connectivity across groups, significantly differentiating PDD from control subjects.
Collectively, these findings reveal convergent evidence across seed-based, ROI-based, graph-theoretical, and composite connectivity analyses, highlighting mPFC-centered DMN alterations as a potential marker of depression in Parkinson’s disease. The progressive reduction of DMN connectivity across groups further supports the involvement of large-scale network dysfunction in depression-related processes in PD. Future studies using larger cohorts and more comprehensive brain parcellations are needed to validate its robustness and clinical utility.
Author Contributions
Geetha Iyer performed the seed-based connectivity analyses. Rosario Huaranca conducted the ROI-to-ROI connectivity analyses. Salma Elatries performed the graph-theoretical analyses. Abdul Rauf Anwar supervised the project. All authors contributed to interpretation, manuscript preparation, and final approval.
Acknowledgments
We thank the Neuromatch Impact Scholar Programme, the Michael J. Fox Foundation, and the Parkinson’s Progression Markers Initiative (PPMI) for supporting this work and providing access to the dataset.
Data Availability
The data used in this study were obtained from the Parkinson’s Progression Markers Initiative (PPMI) database (available at https://
- Cong, S., Xiang, C., Zhang, S., Zhang, T., Wang, H., & Cong, S. (2022). Prevalence and clinical aspects of depression in Parkinson’s disease: A systematic review and meta‑analysis of 129 studies. Neuroscience & Biobehavioral Reviews, 141, 104749. 10.1016/j.neubiorev.2022.104749
- Morgan, H. E., Ledbetter, C. R., Ferrier, C., Zweig, R. M., & Disbrow, E. A. (2018). Altered Cortico-Limbic Network Connectivity in Parkinsonian Depression: The Effect of Antidepressants. Journal of Parkinson’s Disease, 8(3), 429–440. 10.3233/JPD-171204
- Xu, J., Yu, M., Wang, H., Li, Y., Li, L., Ren, J., Pan, C., & Liu, W. (2022). Altered Dynamic Functional Connectivity in de novo Parkinson’s Disease Patients With Depression. Frontiers in Aging Neuroscience, 13, 789785. 10.3389/fnagi.2021.789785
- Zheng, K., Chen, L., Wang, H., Li, B., & Chen, B. (2026). Beyond depression symptoms: the default mode network as a predictor of antidepressant response. Npj Mental Health Research, 5(1), 2. 10.1038/s44184-025-00182-2
- Zhang, Y., Huang, C.-C., Zhao, J., Liu, Y., Xia, M., Wang, X., Wei, D., Chen, Y., Liu, B., Zheng, Y., Wu, Y., Chen, T., Cheng, Y., Xu, X., Gong, Q., Si, T., Qiu, S., Cheng, J., Tang, Y., … Lo, C.-Y. Z. (2024). Dysfunction in sensorimotor and default mode networks in major depressive disorder with insights from global brain connectivity. Nature Mental Health, 2(11), 1371–1381. 10.1038/s44220-024-00323-0
- Sheline, Y. I., Barch, D. M., Price, J. L., Rundle, M. M., Vaishnavi, S. N., Snyder, A. Z., Mintun, M. A., Wang, S., Coalson, R. S., & Raichle, M. E. (2009). The default mode network and self-referential processes in depression. Proceedings of the National Academy of Sciences, 106(6), 1942–1947. 10.1073/pnas.0812686106
- Marek, K., Jennings, D., Lasch, S., Siderowf, A., Tanner, C., Simuni, T., Coffey, C., Kieburtz, K., Flagg, E., Chowdhury, S., Poewe, W., Mollenhauer, B., Klinik, P.-E., Sherer, T., Frasier, M., Meunier, C., Rudolph, A., Casaceli, C., Seibyl, J., … Taylor, P. (2011). The Parkinson Progression Marker Initiative (PPMI). Progress in Neurobiology, 95(4), 629–635. 10.1016/j.pneurobio.2011.09.005
- Nieto-Castanon, & Whitfield-Gabrieli. (2022). CONN functional connectivity toolbox. https://www.hilbertpress.org/link-nieto-castanon2022
- Menon, V. (2011). Large-scale brain networks and psychopathology: a unifying triple network model. Trends in Cognitive Sciences, 15(10), 483–506. 10.1016/j.tics.2011.08.003
- Liao, H., Cai, S., Shen, Q., Fan, J., Wang, T., Zi, Y., Mao, Z., Situ, W., Liu, J., Zou, T., Yi, J., Zhu, X., & Tan, C. (2021). Networks Are Associated With Depression in Patients With Parkinson’s Disease: A Resting-State Imaging Study. Frontiers in Neuroscience, 14. 10.3389/fnins.2020.573538
- Rubinov, M., & Sporns, O. (2010). Complex network measures of brain connectivity: Uses and interpretations. NeuroImage, 52(3), 1059–1069. 10.1016/j.neuroimage.2009.10.003
- Sporns, O. (2018). Graph theory methods: applications in brain networks. Dialogues in Clinical Neuroscience, 20(2), 111–121. 10.31887/DCNS.2018.20.2/osporns
- Levorsen, M., Aoki, R., Sedikides, C., & Izuma, K. (2025). Decomposing Cognitive Processes in the mPFC during Self-Thinking. Journal of Neuroscience, 45(22). 10.1523/JNEUROSCI.2378-24.2025
- Yun, J.-Y., Lee, Y. I., Park, S., Choi, J. M., Choi, S.-H., & Jang, J. H. (2022). Functional activation of insula and dorsal anterior cingulate for conflict control against larger monetary loss in young adults with subthreshold depression: a preliminary study. Scientific Reports, 12(1), 6956. 10.1038/s41598-022-10989-0
- Su, D., Cui, Y., Liu, Z., Chen, H., Fang, J., Ma, H., Zhou, J., & Feng, T. (2022). Altered Brain Activity in Depression of Parkinson’s Disease: A Meta-Analysis and Validation Study. Frontiers in Aging Neuroscience, 14, 806054. 10.3389/fnagi.2022.806054