Oceanic Oscillations and Congo River Basin Climatology
Seminar presentation
This article was presented as part of a series of seminars chaired by scientists from Climatematch Academy’s collaborating organizations, CMIP (Couple Model Intercomparison Project) and LEAP (Learning the Earth with Artificial Intelligence and Physics).
Introduction
According to the IPCC’s 2021 report (IPCC 2021 Climate Change), anthropogenic climate changeis and will increasingly have a significant impact on natural systems that support human wellbeing. The occurrence of extreme weather events induced by climate change have already had adverse effects on terrestrial, freshwater, ocean and coastal ecosystems.These extreme events have also reduced food security; contributed to migration and displacement; threatened livelihoods, the health and security of people; and increased inequality. Global temperature increases have affected sea surface temperature (SST) at the boundary between the ocean and atmosphere. SST directly influences the climate system, particularly atmospheric circulation, rainfall patterns, and storm intensity.
According to the US Environmental Protection Agency (US EPA (2023)), SST has been rising from 1880 to 2020 with the most rapid increases occurring in the last 3 decades. Currently, SST is rising at the rate of 0.14°F per decade. SST varies regionally, with some regions facing warmer and others cooler temperatures (US EPA (2023)). Warmer waters tend to promote the development of stronger storms in the tropics. As oceans absorb excess heat, they release more water vapour, affecting rainfall patterns. This can lead to droughts, heavy precipitation, sea level rise, and stronger storms ECMWF, 2023.
The Congo River basin (CRB) is the second largest river basin in the world, extending over a 3.4 million km2 area in central Africa. Jarugula & McPhaden (2023) note that the Inter Tropical Convergence Zone (ITCZ) movement affects the Congo River discharge (CRD) in a bimodal fashion. Maximum peak precipitation during November–December is followed by a secondary maximum during April–May, with a minima during March and August. Resulting fluctuations in discharge from the Congo river, driven by those changes in precipitation pattern, affect seasonal changes in sea surface salinity in the Eastern Tropical Atlantic. Such salinity changes can impact SST variability, evapotranspiration, eastern equatorial Atlantic local climate, and West African Monsoon onset. However, Jarugula & McPhaden (2023) also note that the Indian Ocean Dipole has a large impact on SST in both the western Indian and the eastern equatorial Atlantic Oceans. These and other studies inspired us to examine oceanic oscillations to the east and west of Africa to explore how they might interact with CRB precipitation patterns.
Material and methodology
Study region
The Congo Basin is the world’s largest carbon sink, absorbing 1.5% of annual global CO2 emissions (White et al. (2021), Hubau et al. (2020)) and plays a vital role in moisture recycling. Nevertheless, it remains underrepresented in the scientific literature compared, for instance, to the Amazon (Alsdorf et al. (2016)). The CRB is home to a diverse population of soil microorganisms, fungi, plants and animals and a growing human population. Yet it is still unclear how increased land use impacts its forest reserves and ecosystem services. Loss of carbon-rich swampy forest and peatland reserves (28% of the world’s tropical peat carbon, see Crezee et al. (2022)) could turn this global carbon sink into a potent carbon source; loss of moisture recycling services threatens the lives and livelihoods of millions through fire, floods, droughts, and crop failure.
Prior work
We received the complete shape file for the CRB from Prof. Raphael M. Tshimanga du Centre de Recherche en Ressources en Eau du Bassin du Congo (Raphael M. Tshimanga, personal communication, 10/10/23). During the Climatematch Academy (CMA) 2023 Summer School our team examined the interaction of precipitation and vegetation changes in the CRB and discerned a clear trend towards decreased precipitation and decreased vegetation over time. Our preliminary analysis compared NDVI vegetation data for the 1982-1992 period with that of the 2012-2022 period, and we examined the CHIRPS precipitation data for the same time periods. The NDVI data showed a substantial decrease in vegetation across the CRB, while the CHIRPS data showed significant decreases in precipitation for much of the CRB (Panel A).
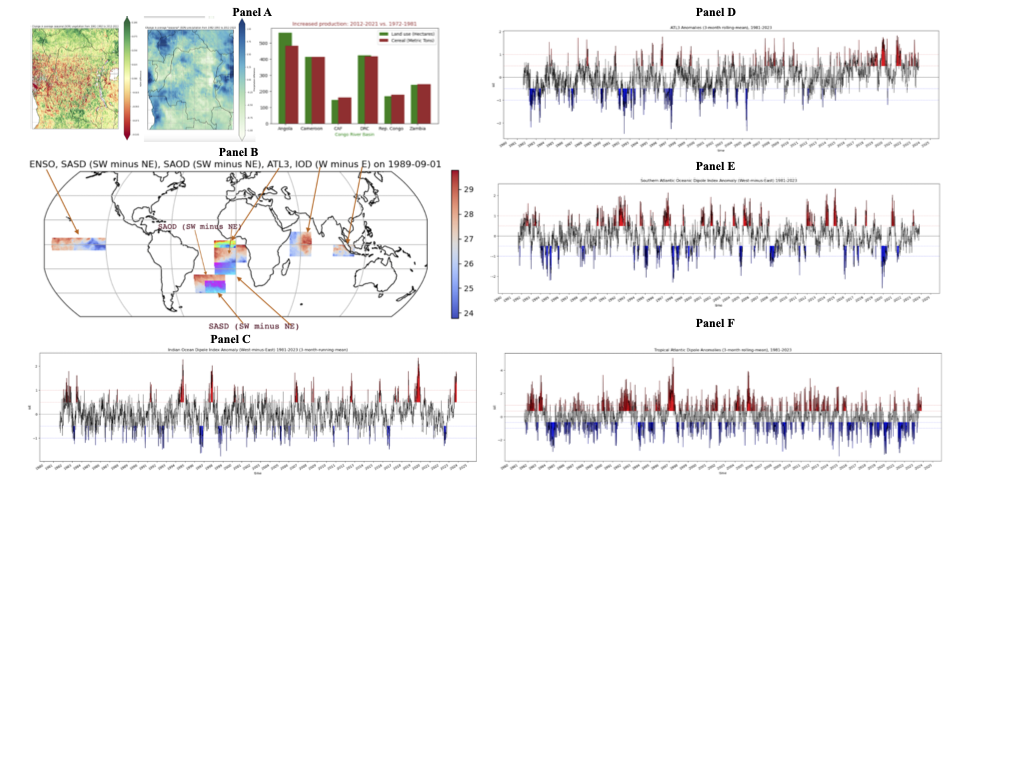
Figure 2:Panel A: NDVI and CHIRPS changes in the CRB. Panel B: Ocean coordinates for indices and dipoles. Panel C: Indian Ocean Dipole (IOD) anomalies. Panel D: ATL3 index. Panel E: South Atlantic Subtropical Dipole (SASD) index. Panel F: Tropical Atlantic (TASI) SST anomaly index.
These preliminary findings raised the question of whether the drop in both vegetation and precipitation was due to global and local temperature increases, demographic and land-use change, specifically deforestation, and how these factors interacted with ENSO to produce extreme events. The picture became more complex when we looked at World Bank data for agricultural land use and crop production in CRB countries. Comparing cereal production and cropland for the 2012-2021 period vs. 1971-1981 showed dramatic increases in agricultural land use and resulting food production, raising questions about what exactly was driving the NDVI and CHIRPS changes.
Data
We downloaded data from NOAA’s mean SST data (oisst.v2) for the full set of years from 1981-2023 NOAA, 2023. The Woods Hole Oceanographic Institute (WHOI) website article, “El Niño & Other Oscillations” https://www.whoi.edu/ (2026) identifies multiple oceanic dipoles and indices Yu et al. (2023) and teleconnections between them. Several recent studies of teleconnection have indicated interactions between ENSO and other oceanic oscillations. Some of these oscillations directly influence CRB precipitation patterns, either individually, or in teleconnection patterns. These oscillations include: Indian Ocean Dipole (IOD) (Jarugula & McPhaden (2023), Zhang & Han (2021)); Southern Atlantic Oceanic Dipole (SAOD) (Santis et al. (2020), Bier & Ambrizzi (2019)); South Atlantic Subtropical Dipole (SASD) Wainer et al. (2014); Tropical Atlantic Interannual Variability (ATL3) a.k.a. the ‘Atlantic Niño’ (Rodríguez‐Fonseca et al. (2009), Zhang et al. (2023)); Tropical North Atlantic Index (TNAI) Polo et al. (2008); Tropical South Atlantic Index (TASI); South Atlantic Tropical (SAT) Index; and North Atlantic Tropical (NAT) Index.
Following the literature, we identified the ocean coordinates used for these indices and dipoles (Panel B).
Methods
We used Python libraries such as Xarray, pandas, numpy, matplotlib and others in Jupyterhub for this analysis, together with scripts provided by the Climatematch Academy, or customised versions of the same. For prior work, we used NDVI (vegetation) and CHIRPS (precipitation) (both masked with the CRB shape file), and World Bank (crop/land-use) data. We downloaded sea surface temperature data from NOAA, then identified the ENSO, IOD, SASD, SAOD, and ATL3 sea surface regions.
Results
We plotted the ENSO climatology and ENSO extreme events for the full NOAA 1981-2023 dataset, extending the time period used in the CMA summer school to the full available dataset from NOAA; the approach was similar to our summer school tutorial. We then plotted anomalies for the Indian Ocean Dipole (IOD), also known as the Dipole Mode Index (DMI). The IOD is calculated by subtracting IOD east: 90°E-110°E, 10°S-0°S from IOD west: 50°E-70°E, 10°S-10°N (Panel C).
The ‘Atlantic Niño’ or ATL3 index is the area-averaged SST anomaly over 20°W-0°, 3°S-3°N, covering the tropical Atlantic ocean area with the largest interannual variance (Panel D) Exarchou et al. (2021).
The South Atlantic Subtropical Dipole index (SASD) is calculated by subtracting the area-averaged SST at SASD’s southwest pole: 30°W-10°W, 30°S-40°S from the area-averaged SST at SASD’s northeast pole: 20°W-0°, 15°S-25°S (Panel E).
Another southern Atlantic dipole index, the Tropical Atlantic (TASI) SST anomaly index is an indicator of the surface temperatures in a broad swath of the tropical South Atlantic Ocean. It is calculated by subtracting the Tropical South Atlantic (TSA) 30°W-10°E, 20°S to 0° from the Tropical North Atlantic (TNA) 55°W-15°W, 5°N-25°N. The TSA SST anomaly index captures surface temperatures, i.e., the meridional surface temperature gradient, in the Gulf of Guinea, the eastern tropical South Atlantic Ocean. The TNA SST anomaly index captures surface temperatures in the eastern tropical North Atlantic Ocean. The north-south difference, i.e., TNA SST minus TSA SST across the equator captures the tropical Atlantic sea surface temperature dipole, the Tropical Atlantic (TASI) SST anomaly index (Panel F).
Discussion
The Subtropical North Atlantic (SNA) sea surface temperature (SST) has been shown to influence Congo River Basin precipitation, with Tropical Atlantic (TA) SST representing a second mode with maximum loadings over the Congo River Basin and the northern Sahel Polo et al. (2008). Polo et al.'s work is part of a broader expansion of research into understanding the teleconnections between multiple oceanic oscillations globally and their effect on precipitation and related weather patterns in various regions around the world.
The Indian Ocean Dipole (IOD), first identified in 1999 Saji et al. (1999), has been shown to have positive and negative phases that are semi-independent of ENSO, and to influence the ATL3-'Atlantic Niño Zhang & Han (2021). A positive phase IOD involves warmer than normal western equatorial/tropical Indian ocean SSTs, and cooler than normal in the eastern Indian ocean (near Java/Sumatra). Positive IOD often brings floods to East Africa while bringing droughts in eastern Asia/Australia. Positive IOD drives significant increases in CRB rainfall, affecting the Congo River discharge and altering eastern tropical Atlantic salinity, driving further feedback in precipitation over the basin. Conversely, during negative IOD years, moisture transport weakens over the CRB Jarugula & McPhaden (2023).
Related work has found that positive IOD-enhanced rainfall in the western tropical Indian Ocean weakens easterly trade winds over the tropical Atlantic, triggering the Atlantic Niño by causing warm anomalies in the central and eastern equatorial Atlantic basin Zhang & Han (2021). Zhang & Han (2021) found that the canonical Atlantic Niño/eastern Atlantic Niño dominated before 2000 (1970-1999). Since 2000 the warm SST anomalies now extend from the western coast of South Africa to the central equatorial Atlantic Ocean. This is most likely due to increasing global temperatures.
These findings and others suggest further exploration of oceanic oscillation teleconnections may help develop a better understanding of Congo River Basin climatology.
Conclusion
Our preliminary work here indicates that while climate change is driving increasing ocean temperatures globally, the sea surface temperature changes within the identified oceanic oscillation indices and dipoles are diverse and not linearly related with global sea surface temperature increases. This diversity and non-linearity invites further investigation both in terms of the teleconnection between the different oceanic oscillations, and their interactions with Congo River Basin climatology.
- on Climate Change (IPCC), I. P. (2023). Climate Change 2021 – The Physical Science Basis: Working Group I Contribution to the Sixth Assessment Report of the Intergovernmental Panel on Climate Change. Cambridge University Press. 10.1017/9781009157896
- US EPA. (2023, July 31). https://web.archive.org/web/20230731183509/https://www.epa.gov/climate-indicators/climate-change-indicators-sea-surface-temperature
- Jarugula, S., & McPhaden, M. J. (2023). Indian Ocean Dipole affects eastern tropical Atlantic salinity through Congo River Basin hydrology. Communications Earth & Environment, 4(1). 10.1038/s43247-023-01027-6
- White, L. J. T., Masudi, E. B., Ndongo, J. D., Matondo, R., Soudan-Nonault, A., Ngomanda, A., Averti, I. S., Ewango, C. E. N., Sonké, B., & Lewis, S. L. (2021). Congo Basin rainforest — invest US$150 million in science. Nature, 598(7881), 411–414. 10.1038/d41586-021-02818-7
- Hubau, W., Lewis, S. L., Phillips, O. L., Affum-Baffoe, K., Beeckman, H., Cuní-Sanchez, A., Daniels, A. K., Ewango, C. E. N., Fauset, S., Mukinzi, J. M., Sheil, D., Sonké, B., Sullivan, M. J. P., Sunderland, T. C. H., Taedoumg, H., Thomas, S. C., White, L. J. T., Abernethy, K. A., Adu-Bredu, S., … Zemagho, L. (2020). Asynchronous carbon sink saturation in African and Amazonian tropical forests. Nature, 579(7797), 80–87. 10.1038/s41586-020-2035-0
- Alsdorf, D., Beighley, E., Laraque, A., Lee, H., Tshimanga, R., O’Loughlin, F., Mahé, G., Dinga, B., Moukandi, G., & Spencer, R. G. M. (2016). Opportunities for hydrologic research in the Congo Basin. Reviews of Geophysics, 54(2), 378–409. 10.1002/2016rg000517
- Crezee, B., Dargie, G. C., Ewango, C. E. N., Mitchard, E. T. A., Emba B., O., Kanyama T., J., Bola, P., Ndjango, J.-B. N., Girkin, N. T., Bocko, Y. E., Ifo, S. A., Hubau, W., Seidensticker, D., Batumike, R., Imani, G., Cuní-Sanchez, A., Kiahtipes, C. A., Lebamba, J., Wotzka, H.-P., … Lewis, S. L. (2022). Mapping peat thickness and carbon stocks of the central Congo Basin using field data. Nature Geoscience, 15(8), 639–644. 10.1038/s41561-022-00966-7
- El Niño & Other Oscillations - Woods Hole Oceanographic Institution. (n.d.). https://www.whoi.edu/. Retrieved January 23, 2026, from https://www.whoi.edu/ocean-learning-hub/ocean-topics/how-the-ocean-works/ocean-circulation/el-nio-other-oscillations/
- Yu, L., Zhong, S., Vihma, T., Sui, C., & Sun, B. (2023). A change in the relation between the Subtropical Indian Ocean Dipole and the South Atlantic Ocean Dipole indices in the past four decades. Atmospheric Chemistry and Physics, 23(1), 345–353. 10.5194/acp-23-345-2023
- Zhang, L., & Han, W. (2021). Indian Ocean Dipole leads to Atlantic Niño. Nature Communications, 12(1). 10.1038/s41467-021-26223-w
- Santis, W., Castellanos, P., & Campos, E. (2020). Memory Effect of the Southern Atlantic Subtropical Dipole. Journal of Climate, 33(17), 7679–7696. 10.1175/jcli-d-19-0745.1
- Bier, A. A., & Ambrizzi, T. (2019). South Atlantic Dipole Changes From 1851 to 2010. 2019, A21J-2742. https://ui.adsabs.harvard.edu/abs/2019AGUFM.A21J2742B
- Wainer, I., Prado, L. F., Khodri, M., & Otto-Bliesner, B. (2014). Reconstruction of the South Atlantic Subtropical Dipole index for the past 12,000 years from surface temperature proxy. Scientific Reports, 4(1). 10.1038/srep05291
- Rodríguez‐Fonseca, B., Polo, I., García‐Serrano, J., Losada, T., Mohino, E., Mechoso, C. R., & Kucharski, F. (2009). Are Atlantic Niños enhancing Pacific ENSO events in recent decades? Geophysical Research Letters, 36(20). 10.1029/2009gl040048
- Zhang, L., Wang, C., Han, W., McPhaden, M. J., Hu, A., & Xing, W. (2023). Emergence of the Central Atlantic Niño. Science Advances, 9(43). 10.1126/sciadv.adi5507