Long-term Climatological Patterns of Cloud Coverage and NDVI in East Africa
Abstract
The study investigates climate-vegetation dynamics in the Juba-Shabelle basin using AVHRR v5 and VIIRS v1 NDVI data. Cloud coverage’s impact on regional NDVI estimates is analyzed for sustainable resource management. Satellite sensors, crucial for assessing vegetation dynamics, reveal seasonal NDVI and cloud variations and long term spatial distribution. Results show increased pixel loss during rainy seasons due to clouds, highlighting their impact on vegetation estimates. The study underscores the importance of understanding land-atmosphere interactions for sustainable management, suggesting methods to mitigate cloud impact on NDVI calculations. Future research may focus on El Niño’s lag correlation with NDVI, aiding food security predictions.
Seminar presentation
This article was presented as part of a series of seminars chaired by scientists from Climatematch Academy’s collaborating organizations, CMIP (Couple Model Intercomparison Project) and LEAP (Learning the Earth with Artificial Intelligence and Physics).
Long-term Climatological Patterns of Cloud Coverage and NDVI in East Africa
Introduction
Climate plays a pivotal role in shaping terrestrial ecosystems on both regional and global scales Delire et al. (2011), with the intricate nature of vegetation cover serving as a vivid reflection of the fragility and instability inherent in these ecosystems De Graff (2018). Notably, in East Africa, the economy relies heavily on the exploitation of natural resources, contributing directly to the observed abnormal changes in climate Huq et al. (2006). In contemporary research, satellite sensors have evolved into indispensable tools for investigating vegetation dynamics and trends at a regional to global scale Ssemmanda et al. (2014) Cao et al. (2017). Notable works have been done to deepen into the relations of vegetation and its environment Walther et al. (2002) Zhou et al. (2014). Plisnier et al. (2000) delved into the intricate web of tele-connections between El Niño Southern Oscillation (ENSO) and ecosystems, utilizing NDVI and ENSO indices, and climate data. Their findings validated the considerable influence of ENSO on climate and ecological fluctuations. Examining the NDVI anomaly in East (South) Africa from 1997 to 2000 revealed a significant reversal associated with precipitation patterns, indicating a transition from El Niño to La Niña conditions. Landmann & Dubovyk (2014) integrated NDVI data with rainfall records from the Tropical Rainfall Measuring Mission covering the period of 2001–2011 in East Africa. Their results uncovered declining yields attributed to both vegetation degradation and human-induced alterations to the land. Given the current state of research in the region of interest, the aim of this study is to describe climatological patterns of cloud coverage for a long-term period and to assess the impact of the cloud coverage values over regional NDVI values.
Area study and data
The Juba-Shabelle basin is places between the Ethiopian highlands at an altitude of about 4230 m a.s.l. and the Mount Kenya (5195 m a.s.l.). The total catchment area is 796600 km2. The Shabelle river joins the Juba River when rain is exceptional, otherwise it ends in Somalian sand depression areas. The average annual rainfall in the mountains is 1500-1600 mm and 200 mm downstream Elmi Mohamed (2013).
We have used the NOAA Climate Data Record (CDR) of AVHRR Normalized Difference Vegetation Index (NDVI) Version 5 and VIIRS Normalized Difference Vegetation Index (NDVI) Version 1 at a spatial resolution of 0.05° and a daily temporal resolution. The datasets were retrieved from https://
Methods
The data mainly consists of daily netCDF files. We combined the data to check homogeneous metadata to future array operations and clip the extension using a vector file of our study area so the data weights less and can be treated locally. The cloud-mask property corresponds to the state of cloud coverage, which at the same time depends on the stability of the troposphere at different levels and its thermodynamic processes. Two applications can be derived by this advantage: to create a cloud coverage record and to assess its impact on the NDVI regional values by its distribution and quantity as lost data (NDVI must be superficial). Once the daily data is cleaned from cloud-contaminated pixels, it is ready to have a preliminary monthly reduction. This step helps to fill pixels and to create representative values in the case of overlapping existing values from different days of the month. Regional NDVI for the basin was created using the median to create intermonthly variation of monthly mean NDVI. Now, this is a key point in the study as we have not done interpolations or other technique to fill the persisting missing values despite the monthly averages; in that sense we can estimate not only how much data is lost by seasonal effect, but where it is and how it is distributed. So, a count of monthly null values is done to go along with the regional NDVI which is supposed to be affected in a negative way.
In assessing the association of the percentage of lost pixels per month as the independent variable with its respective regional NDVI (which is to be imperfect as it comes from considerable lack of pixels), we used a linear regression model Ghebrezgabher et al. (2020) Al-Kindi et al. (2023). The slope of the regression indicates the average change of the regional NDVI by the number of lost pixels by cloud occurrence and a negative value would mean a decreasing trend and a positive one, an increasing trend. A monthly plot of missing values is done by a monthly to-grid accumulation of missing values during the climatology period. That is, how the climatology of cloud draws over the region of study insistently, because it means cloud activity every available day in the monthly composition Yaringaño Garcia (2022) Armitage et al. (2013).
Results and discussions
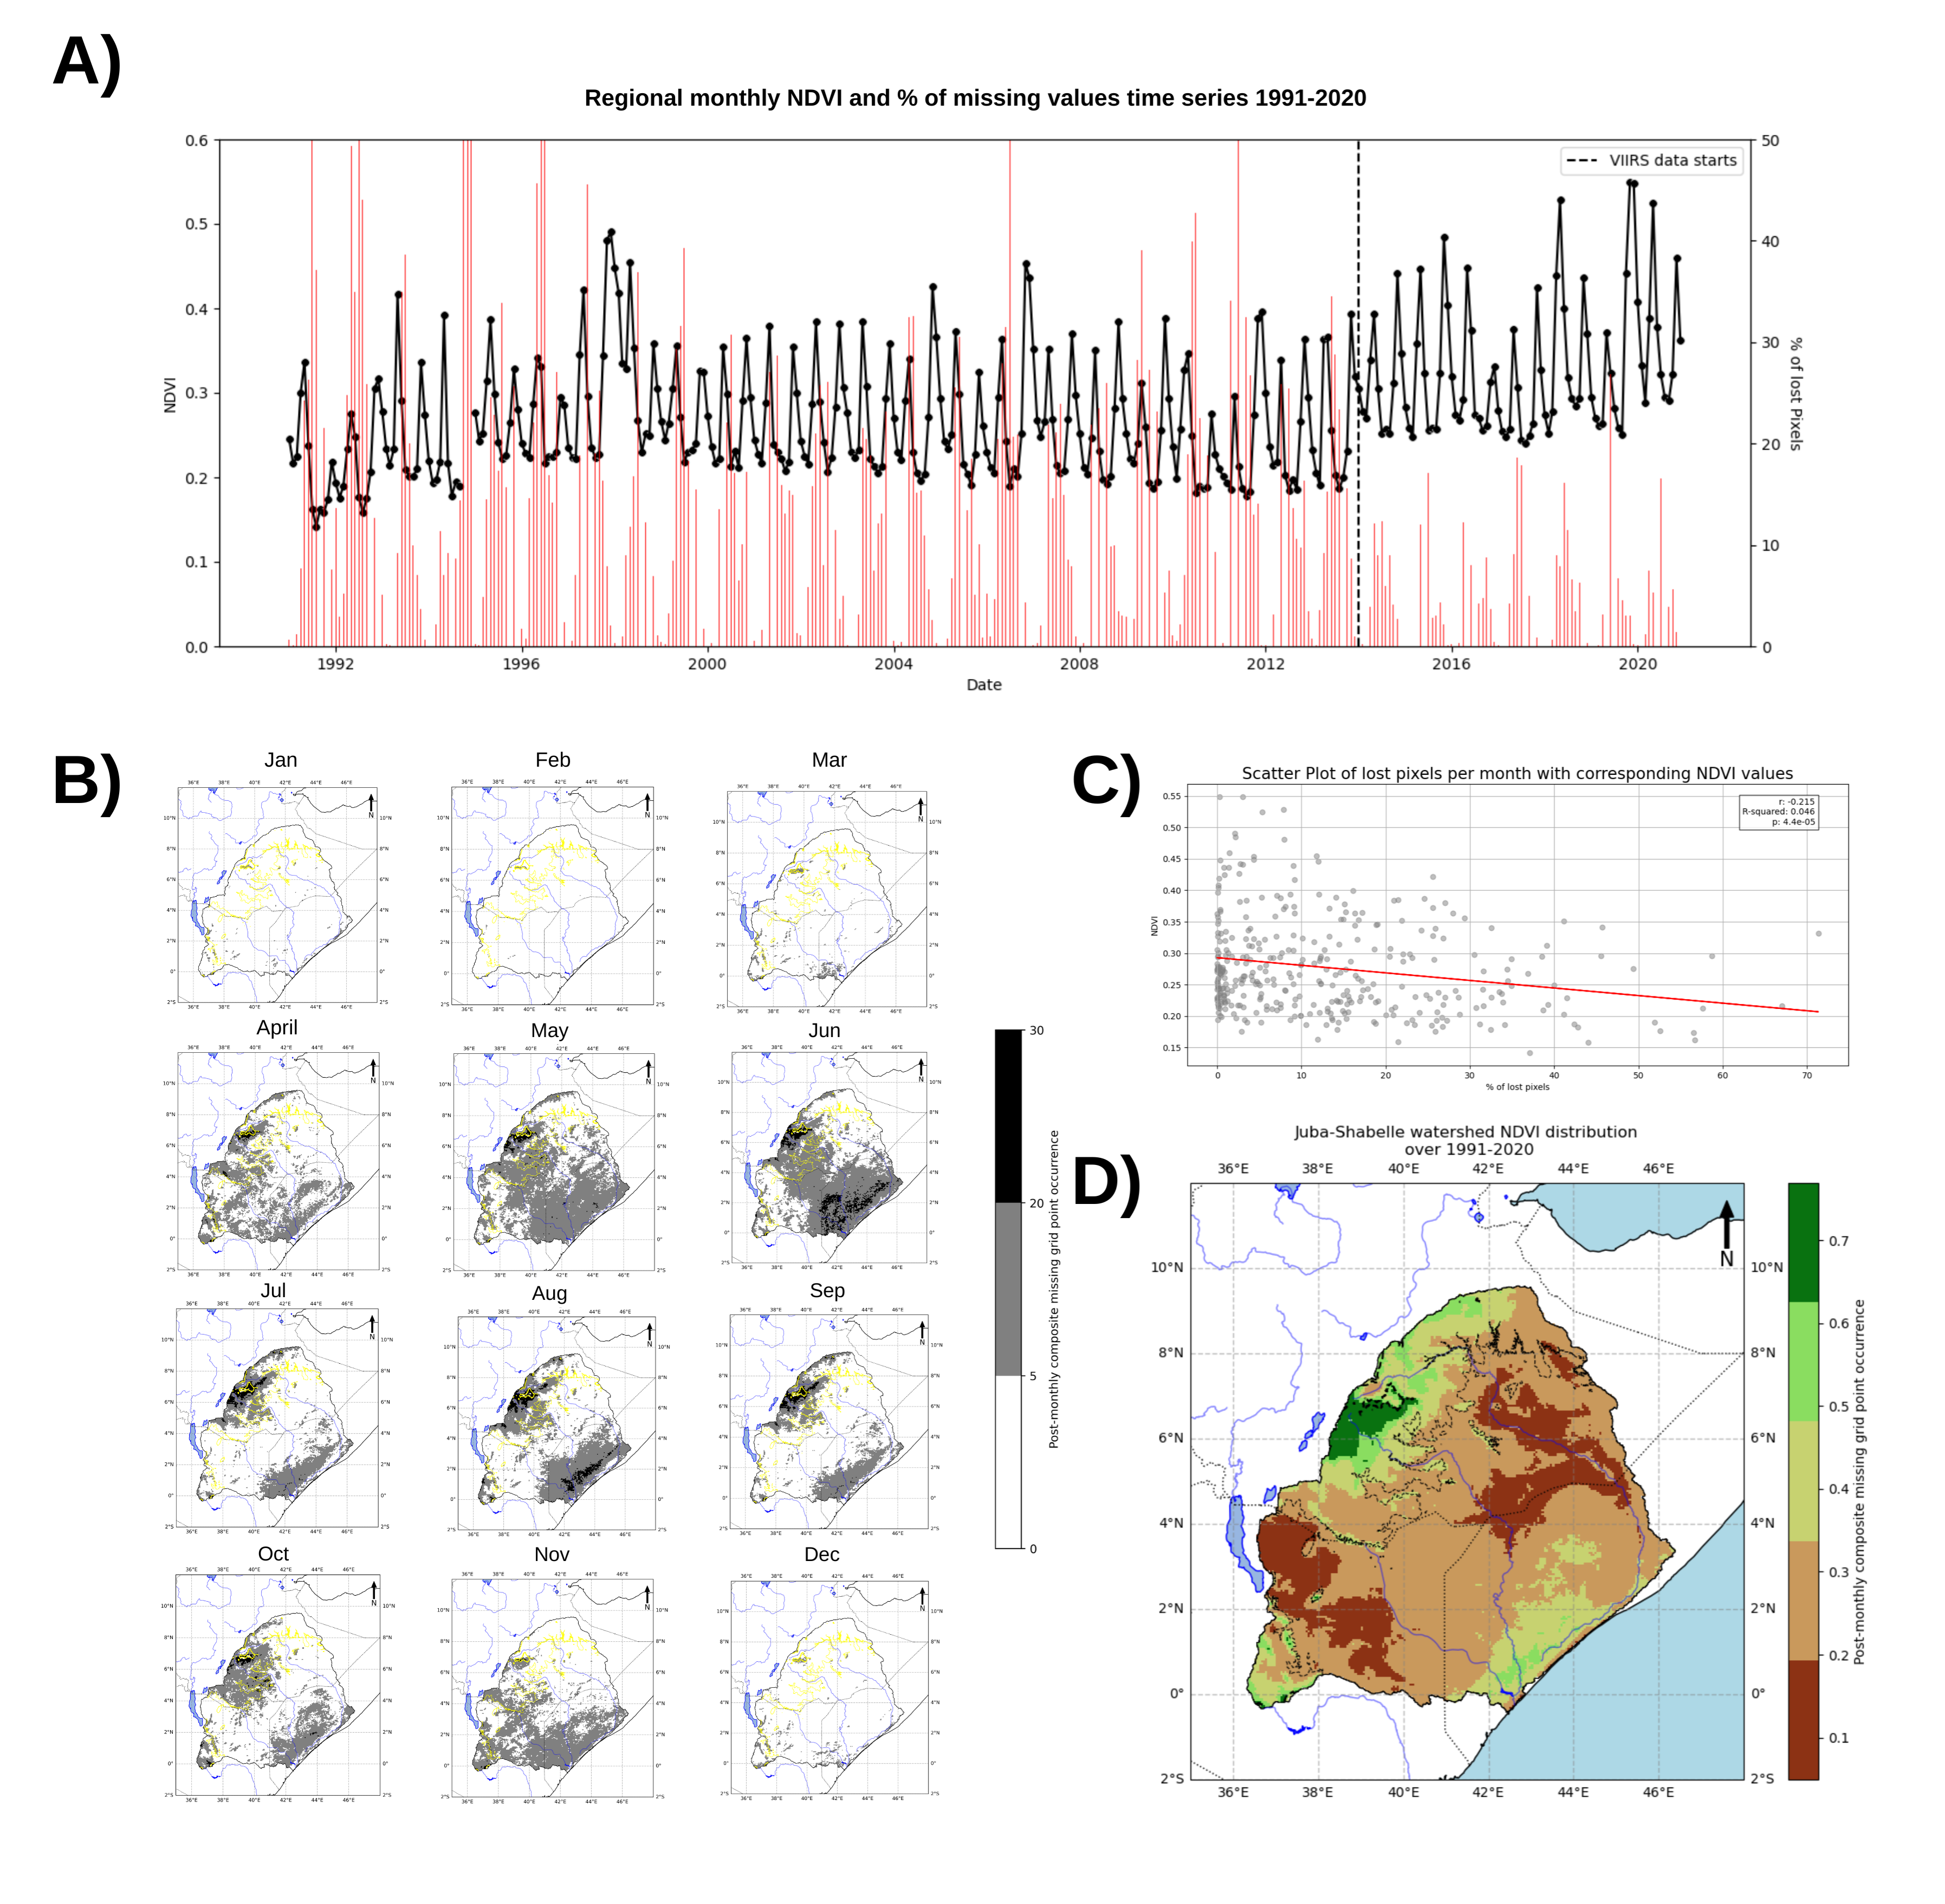
Figure 2:A) Interannual variation of mean NDVI from 1991 to 2020. B) Monthly cycle of cloud coverage distribution. C) Scatter plot between regional number of pixels of cloud coverage and NVDI as independent and dependent parameters respectively. D) Mean NDVI from 1991 to 2020 over the Juba-Shabelle basin in East Africa.
Figure 2 A shows the intermonthly variation of monthly mean NDVI and percentage of lost pixels by insistence of clouds in bars. The time series has the NDVI fixed in between 0 and 0.6 (dimensionless NDVI-value), while the bars are set between 0 and 50% of the area with missing values. Both variables act seasonally. More pixels are lost in the rainy seasons of boreal spring and summer (April to September) due to the cloud coverage. Despite having done a monthly composition of the daily available data, some regions lack information due to constant convective activity. There are two apparent peaks in a year found in April (early spring) and november (mid-autumn) going through gradually low NDVI values in winter and summer. In general, in the East Africa region NDVI values gradually rise from spring to rainy season and fall steadily from autumn to winter.
It is evident also that from 2014 on the values in each variable contrast in magnitude. The NDVI values, that range between 0.2 and 0.4 through the year, change to 0.25 to 0.45. However, each sensor has different orbital characteristics and product generation corrective algorithms, and because of that there is a difference in values of NDVI and the range that oscillates Miura et al. (2013). Also, the VIIRS series works with more bits, which allows representativeness of the NDVI values, which can be observed in a lower percentage of lost pixels after 2014.
In section B we plot the accumulation of missing pixels over the long-term series, by month, to aboard the cloud patterns in a spatial perspective. Constant cloud coverage/missing pixels concentrates in the high region of the study area above 1000 m a.s.l., and the low region-near the Indian Ocean in the Banaadir coast. The white areas indicate low monthly cloud occurrence where the reduction could be constructed with 25 values out of 30. The gray areas represent the pixels that had 16 to 66% of the data gone by cloud coverage. The black areas show an important void of values which is consistent despite the monthly reductions that represent the most probable places for rain activity thence higher NDVI. Surface reflectance can not be found, for example, in July near the ethiopian mountains almost for any year as they are climatological regions for convective cloud formation activated by the summer conditions.
Figure 2 C shows a resulting negative correlation between percentage and regional NDVI in which the high NDVI values are more likely to be found in a complete array of monthly values, and low NDVI values as the lost pixels increase. In complete arrays we can get 0.4 to 0.5. The coefficient is approximately -0.21, which despite being small, is a significant negative correlation; the R-squared 0.04, and the p-value of the regression way less than the significance level (0.05), meaning that we have enough evidence to reject the null hypothesis. This could explain the decreased NDVI values between summer and autumn corresponding to the transition between the length of both growing seasons which rests as an average to the lowest and highest NDVI values from winter and spring Ghebrezgabher et al. (2020).
The spatial distribution of the 30-year averaged monthly NDVI over the area of study is presented in Figure 2 D. We take advantage of elevation dashed lines to see the association of the geography with the concentration of forest lands. The predominant vegetation cover types in the Juba-Shabelle basin are grasslands, woodlands, and agricultural lands (croplands) with the NDVI values that correspond to the range of 0.2-0.6. Values greater than 0.7 are in the forest area in the Ethiopian Highlands and Ahmar Mountains, northeast near the basin border Kalisa et al. (2019). Unlike the other areas, these values are reached because of an annual precipitation of 850 mm Ghebrezgabher et al. (2020).
Conclusions and recommendations
Vegetation is concentrated along the coast of Somalia and the Ahmar mountain range because of orographic rainfall with decreased vegetation distribution and deserts in the northeast and central regions of the basin. Additionally, an increase in monthly NDVI across the basin appears to be related to a decrease in lost pixels. This is due to cloud coverage predominantly occurring over more vegetated regions. It is important to consider the impact of this lost information because of cloud coverage. Expectedly, this impact reaches a maximum during boreal summer months. As such, regional NDVI calculations may be particularly underestimated during this timeframe. A potential method for reducing the impact of cloud coverage on NDVI calculations would be spatial and temporal interpolation. Another next step is to determine the lag correlation between El Nino events and impact on NDVI. This would allow for the improvement of predictions, which are useful for food security in the region.
- Delire, C., de Noblet-Ducoudré, N., Sima, A., & Gouirand, I. (2011). Vegetation Dynamics Enhancing Long-Term Climate Variability Confirmed by Two Models. Journal of Climate, 24(9), 2238–2257. 10.1175/2010jcli3664.1
- De Graff, J. V. (2018). Vegetation Cover. In Encyclopedia of Engineering Geology (pp. 923–924). Springer International Publishing. 10.1007/978-3-319-73568-9_288
- Huq, S., Reid, H., & Murray, L. (2006). Climate Change and Development Links. https://www.researchgate.net/publication/45182806_Climate_Change_and_Development_Links
- Ssemmanda, I., Gelorini, V., & Verschuren, D. (2014). Sensitivity of East African savannah vegetation to historical moisture-balance variation. Climate of the Past, 10(6), 2067–2080. 10.5194/cp-10-2067-2014
- Cao, Z., Li, Y., Liu, Y., Chen, Y., & Wang, Y. (2017). When and where did the Loess Plateau turn “green”? Analysis of the tendency and breakpoints of the normalized difference vegetation index. Land Degradation & Development, 29(1), 162–175. 10.1002/ldr.2852
- Walther, G.-R., Post, E., Convey, P., Menzel, A., Parmesan, C., Beebee, T. J. C., Fromentin, J.-M., Hoegh-Guldberg, O., & Bairlein, F. (2002). Ecological responses to recent climate change. Nature, 416(6879), 389–395. 10.1038/416389a
- Zhou, L., Tian, Y., Myneni, R. B., Ciais, P., Saatchi, S., Liu, Y. Y., Piao, S., Chen, H., Vermote, E. F., Song, C., & Hwang, T. (2014). Widespread decline of Congo rainforest greenness in the past decade. Nature, 509(7498), 86–90. 10.1038/nature13265
- Plisnier, P. D., Serneels, S., & Lambin, E. F. (2000). Impact of ENSO on East African ecosystems: a multivariate analysis based on climate and remote sensing data. Global Ecology and Biogeography, 9(6), 481–497. 10.1046/j.1365-2699.2000.00208.x
- Landmann, T., & Dubovyk, O. (2014). Spatial analysis of human-induced vegetation productivity decline over eastern Africa using a decade (2001–2011) of medium resolution MODIS time-series data. International Journal of Applied Earth Observation and Geoinformation, 33, 76–82. 10.1016/j.jag.2014.04.020
- Elmi Mohamed, A. (2013). Managing Shared Basins in the Horn of Africa – Ethiopian Projects on the Juba and Shabelle Rivers and Downstream Effects in Somalia. Natural Resources and Conservation, 1(2), 35–49. 10.13189/nrc.2013.010203
- Yaringaño Garcia, K. F. (2022). Variación espacio-temporal de la nubosidad usando el producto máscara de nubes modis sobre el Perú. https://hdl.handle.net/20.500.12996/5227
- Fan, X., & Liu, Y. (2016). A global study of NDVI difference among moderate-resolution satellite sensors. ISPRS Journal of Photogrammetry and Remote Sensing, 121, 177–191. 10.1016/j.isprsjprs.2016.09.008
- Ghebrezgabher, M. G., Yang, T., Yang, X., & Eyassu Sereke, T. (2020). Assessment of NDVI variations in responses to climate change in the Horn of Africa. The Egyptian Journal of Remote Sensing and Space Science, 23(3), 249–261. 10.1016/j.ejrs.2020.08.003
- Al-Kindi, K. M., Al Nadhairi, R., & Al Akhzami, S. (2023). Dynamic Change in Normalised Vegetation Index (NDVI) from 2015 to 2021 in Dhofar, Southern Oman in Response to the Climate Change. Agriculture, 13(3), 592. 10.3390/agriculture13030592
- Armitage, R. P., Alberto Ramirez, F., Mark Danson, F., & Ogunbadewa, E. Y. (2013). Probability of cloud-free observation conditions across Great Britain estimated using MODIS cloud mask. Remote Sensing Letters, 4(5), 427–435. 10.1080/2150704x.2012.744486