Impacts of ENSO on Climate Variable in the Pacific Region
Seminar presentation
This article was presented as part of a series of seminars chaired by scientists from Climatematch Academy’s collaborating organizations, CMIP (Couple Model Intercomparison Project) and LEAP (Learning the Earth with Artificial Intelligence and Physics).
Impacts of ENSO on Climate Variable in the Pacific Region
Introduction
The El Niño - Southern oscillation (ENSO) is a naturally occurring phenomenon marked by distinct phases involving shifts in ocean surface temperatures across the central and eastern tropical Pacific (CEP) regions. ENSO is generally classified into two phases, determined based on the Oceanic Niño index (ONI). This index is derived by computing a spatial mean of sea surface temperature (SST) anomalies over the Niño 3.4 region, followed by a 5-month running mean, which helps in mitigating noise in data and is useful in finding long-term patterns. The El Niño phase occurs when the ONI is +0.5°C above the average SST, leading to increased precipitation in the CEP regions. Conversely, La Niña is the opposite phase, with ONI dropping -0.5°C below the average resulting in reduced precipitation in the CEP regions. ENSO events significantly impact regional climate and have considerable socioeconomic implications, affecting areas such as agricultural productivity, human health, frequency of natural disasters and the rate of people affected by them Adams et al., 1999McGregor & Ebi, 2018Lam et al., 2019. Even though ENSO is a periodic phenomena, anthropogenic factors brings about unforeseeable variations with implications for the weather prediction. Further, ENSO-related extreme weather events, coupled with decrease in crop yields and fisheries, contribute to economic losses globally (Liu et al. (2023)). Hence, it is crucial to understand the impacts of ENSO on various climate variables. This study aimed to elucidate the primary effects of ENSO in and around the Pacific region by demonstrating how several climate factors such as precipitation, SST and air temperature vary depending on the ENSO state.
Data and methodology
This study investigated the relationships between ENSO and precipitation, SST and air temperature. ENSO was estimated based on the Oceanic Nino Index (ONI). The ONI data was generated by taking a spatial and temporal (5-month running) mean of SST anomaly of the Niño region (5°S-5°N, 190°W-240°W). Correlations between SST anomaly and ONI are computed and significant correlations at 5% level are plotted in a contour world map. The same was carried out for precipitation and air temperature anomalies. To derive the ONI, we used the U.S. National Oceanic and Atmospheric Administration (NOAA) Extended Reconstructed Sea Surface Temperature (ERSST.v5) dataset Huang et al. (2017). The same data was also used to extract the global SSTs used in the correlation analysis. This ERSST.v5 dataset provides spatially complete SSTs at monthly intervals over the global ocean for the time period from 1854 to present. For precipitation, we considered the CPC (Climate Prediction Center) Merged Analysis of Precipitation (CMAP) datasets, which include a global time series of monthly and pentad (5-day) mean precipitation values. For air temperature, we used the Surface Temperature Analysis anomalies from the Goddard Institute for Space Studies (GISS) of the U.S. National Aeronautics and Space Administration (NASA). These air temperatures are an estimate of global surface temperature change. For the analysis of cloud coverage, data from the CESM2 model under a Coupled Model Intercomparison Project phase 6 (CMIP6) (Danabasoglu (2019)) configuration was used.
Results
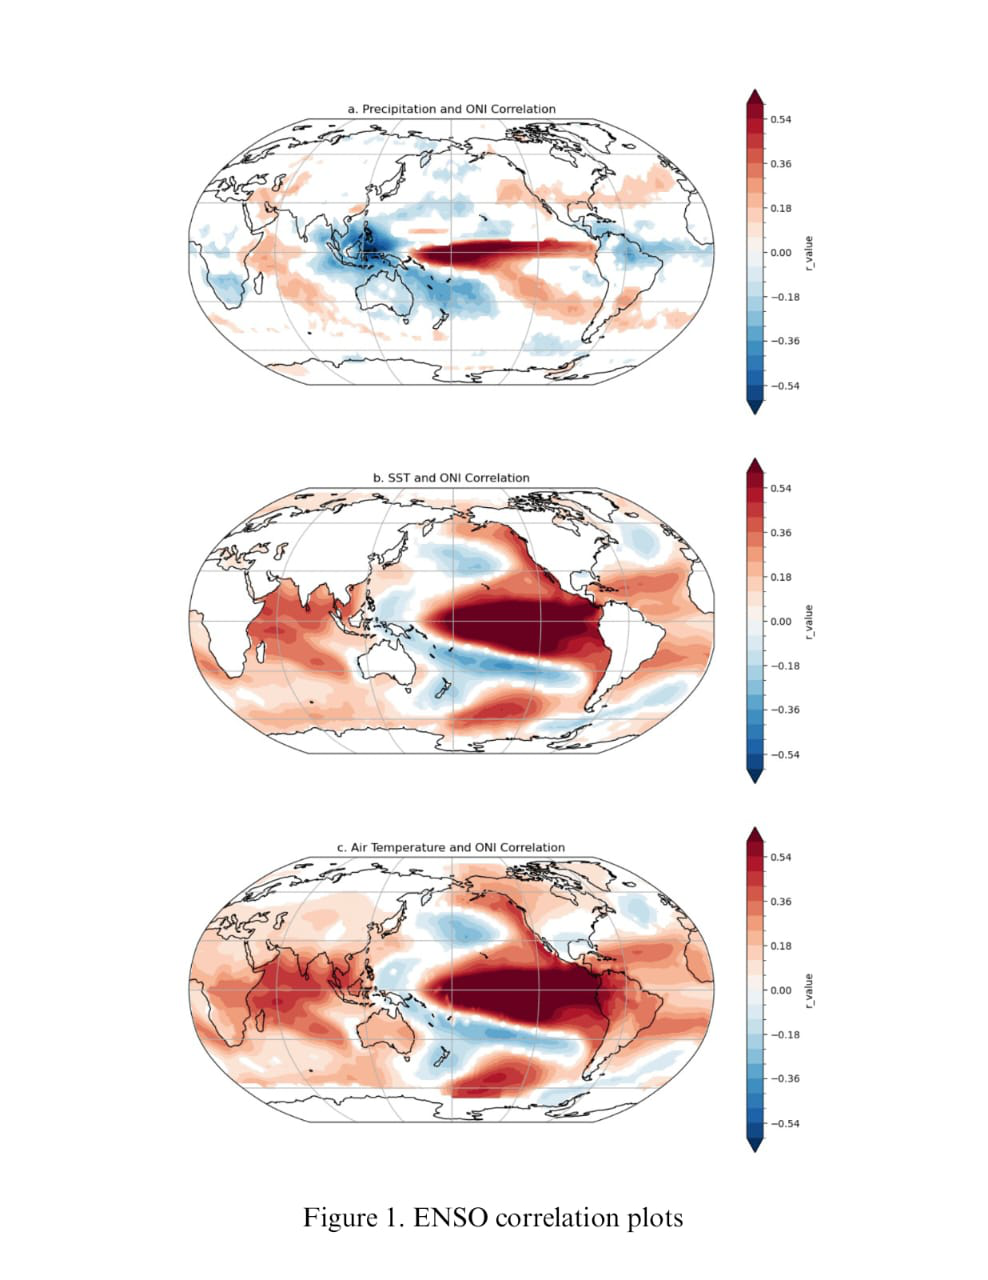
Figure 2:ENSO correlation plots. (a) Precipitation and ONI correlation (b) SST and ONI correlation (c) Air Temperature and ONI correlation
The correlation map between precipitation and ONI shows distinct correlation patterns (Figure 2 a), particularly in equatorial and tropical regions. Conversely, temperate and Antarctic regions exhibited localised correlations. Focusing on the tropical and equatorial regions, a distinctive ‘C’-shaped region associated with a significant negative correlation was observed on the western side of the Pacific. This area encompasses portions of Southeast Asia, Australia, and extends into the South Pacific Ocean. During El Nino years, the central equatorial Pacific experiences weakened westward winds and elevated SSTs resulting in increased precipitation over the same region. Conversely, in the ‘C’-shaped region, precipitation is decreased (Figure 2 a) due to reduced atmospheric water and subsequent condensation (Gushchina et al. (2020)). During La Nina years, on the other hand, strengthened westward winds redirect evaporation from the central Pacific into the ‘C’ region. In these years, the SSTs are below average in the central Pacific and above average near the ‘C’-shaped region, leading to increased evaporation in the latter region and a subsequent rise in rain-inducing clouds and precipitation. This observation serves as a demonstration of the relation between ENSO and the Walker circulation (BJERKNES (1969)). The correlation maps of ONI with both air temperature and SST (Figures 1b and c) showed a remarkable similarity between the two. In both maps the correlation was predominantly positive covering most of the globe with a few negatively correlated regions. This indicates that global air temperatures tend to have a positive correlation with the ONI. In other words, the Earth generally becomes warmer during El Nino years (high ONI) and relatively colder during La Nina years (low ONI). The Polar regions showed no correlation, highlighting how ENSO does not directly influence polar air temperatures. When focusing on patterns within the air temperature correlation and SST correlation (Figure 2 b and c), an expansive blue region becomes evident, covering the West, South, and certain northern parts of the equatorial Pacific. Our investigation into the factors influencing this negative correlation led us to the following understanding. During El Niño years, convection, which is the vertical movement of warm and moist air resulting in cloud formation and precipitation, is enhanced in the central equatorial Pacific, occurring more to the East than in non-El Niño years. As a result, trade (westward) winds are weakened and cooler temperatures are observed in the western Pacific for both air and SST. Conversely, during La Nina years, the convection occurs later than usual, shifting more to the West. As a result, temperatures in the western Pacific become warmer for both air and SST, establishing a clear negative correlation. As for the negative correlation in the southern and northern Pacific, we believe it is closely related to the impacts of the Hadley cells and clouds. The heat in the equatorial region rises, and as the air cools down, it descends with downward winds in the subtropical regions—characteristic of the Hadley cells. This phenomenon causes low clouds in the subtropics, as it prevents moisture from rising high in the area. Low clouds are known to have cooling effects on surface temperatures (Bony et al. (2004)). El Nino amplifies the Hadley cells (Hu et al. (2018)). In contrast, a lower temperature in the central equatorial Pacific during a La Nina year weakens the Hadley cells (Hu et al. (2018)). Due to a lack of observation data on ocean currents, we were unable to calculate correlation between ocean currents and ENSO. However, previous studies have noted the presence of a Bjerknes feedback loop (McPhaden et al. (2006)). The El Niño-Southern Oscillation (ENSO) hinges on the Bjerknes feedback, a crucial mechanism in the tropical Pacific. Under normal conditions, intensified trade winds lead to the piling up of warm water in the western Pacific, with colder water upwelling in the east. This creates an east-west temperature contrast, reinforcing trade winds. However, during El Niño, weakened trade winds allow warm water to migrate eastward, causing anomalous warming. This disrupts the usual feedback loop, triggering basin-scale waves that elevate sea levels, modify ocean currents, and raise air temperatures. As El Niño progresses, equatorial waves and upwelling favourable waves cooperate to induce cooling effects, ultimately terminating the event. The Bjerknes feedback, along with equatorial wave dynamics, intricately regulates the magnitude and duration of ENSO events, significantly impacting the Pacific climate system.
Conclusion
The findings of our study on the Oceanic Nino Index (ONI) and its correlations with climatic variables have significant socioeconomic implications, particularly for countries around the Pacific basin. The distinct precipitation patterns observed during El Niño and La Niña events have direct and tangible effects on various sectors. In regions encompassing Southeast Asia, Australia, and parts of the South Pacific Ocean, characterised by the ‘C’-shaped region, the reduced precipitation during El Niño years can lead to severe consequences for agriculture. Conversely, during La Niña events, the increased precipitation in the same ‘C’-shaped region may result in flooding, posing threats to infrastructure, disrupting transportation, and causing damage to crops. Excessive rainfall can trigger landslides and soil erosion, exacerbating challenges for agriculture and increasing the risk of waterborne diseases. The broader positive correlation between ONI, air temperature, and SST on a global scale implies temperature-related challenges for socioeconomic sectors. In summary, the climatic variations associated with El Niño and La Niña events can result in tangible socioeconomic consequences. These include disruptions in agriculture, potential losses in crop yields, water scarcity, infrastructure damage from flooding, and challenges in various economic sectors due to temperature fluctuations. Understanding how certain regions are linked to ENSO becomes crucial in the uncertain times of climate change, leading to stronger ENSO events, which may only amplify in the future. Preparing for these impacts are crucial for the affected countries to develop adaptive strategies, resilience measures, and effective policies to mitigate the adverse effects on their communities and economies.
- Adams, R., Chen, C., McCarl, B., & Weiher, R. (1999). The economic consequences of ENSO events for agriculture. Climate Research, 13, 165–172. 10.3354/cr013165
- McGregor, G. R., & Ebi, K. (2018). El Niño Southern Oscillation (ENSO) and Health: An Overview for Climate and Health Researchers. Atmosphere, 9(7), 282. 10.3390/atmos9070282
- Lam, H. C. Y., Haines, A., McGregor, G., Chan, E. Y. Y., & Hajat, S. (2019). Time-Series Study of Associations between Rates of People Affected by Disasters and the El Niño Southern Oscillation (ENSO) Cycle. International Journal of Environmental Research and Public Health, 16(17), 3146. 10.3390/ijerph16173146
- Liu, Y., Cai, W., Lin, X., Li, Z., & Zhang, Y. (2023). Nonlinear El Niño impacts on the global economy under climate change. Nature Communications, 14(1). 10.1038/s41467-023-41551-9
- Huang, B., Thorne, P. W., Banzon, V. F., Boyer, T., Chepurin, G., Lawrimore, J. H., Menne, M. J., Smith, T. M., Vose, R. S., & Zhang, H.-M. (2017). NOAA Extended Reconstructed Sea Surface Temperature (ERSST), Version 5. NOAA National Centers for Environmental Information. 10.7289/V5T72FNM
- Danabasoglu, G. (2019). NCAR CESM2 model output prepared for CMIP6 CMIP historical. Earth System Grid Federation. 10.22033/ESGF/CMIP6.7627
- Gushchina, D., Zheleznova, I., Osipov, A., & Olchev, A. (2020). Effect of Various Types of ENSO Events on Moisture Conditions in the Humid and Subhumid Tropics. Atmosphere, 11(12), 1354. 10.3390/atmos11121354
- BJERKNES, J. (1969). ATMOSPHERIC TELECONNECTIONS FROM THE EQUATORIAL PACIFIC1. Monthly Weather Review, 97(3), 163–172. https://doi.org/10.1175/1520-0493(1969)097<;0163:atftep>2.3.co;2
- Bony, S., Dufresne, J.-L., Le Treut, H., Morcrette, J.-J., & Senior, C. (2004). On dynamic and thermodynamic components of cloud changes. Climate Dynamics, 22(2–3), 71–86. 10.1007/s00382-003-0369-6
- Hu, Y., Huang, H., & Zhou, C. (2018). Widening and weakening of the Hadley circulation under global warming. Science Bulletin, 63(10), 640–644. 10.1016/j.scib.2018.04.020
- McPhaden, M. J., Zebiak, S. E., & Glantz, M. H. (2006). ENSO as an Integrating Concept in Earth Science. Science, 314(5806), 1740–1745. 10.1126/science.1132588