Assessing Spatio-Temporal Precipitation Variability and Extreme Events in India
Seminar presentation
This article was presented as part of a series of seminars chaired by scientists from Climatematch Academy’s collaborating organizations, CMIP (Couple Model Intercomparison Project) and LEAP (Learning the Earth with Artificial Intelligence and Physics).
Introduction and Motivation
India’s extensive geographical diversity and climate variations make it crucial to examine the fluctuations in climate patterns due to anthropogenic climate change. India lies between latitudes 8°4′ N and 37°6′ N and longitudes 68°7′ E and 97°25′ E. Further, India’s significant portion of the population relies on agriculture, which is primarily dependent on rainfall. Extreme weather events are creating a huge impact on communities across the world. In India, climate change-related extreme precipitation has led to the loss of 130,000 lives alone over the last 50 years. Additionally, damage to crops has led to the loss of revenue to the exchequer of $159 billion in agriculture, manufacturing and the service industry in 2021. This year alone we have witnessed cyclones, extreme flooding, and heatwaves. We know from prevailing research that the most marginal communities suffer the worst consequences of extreme precipitation events either due to income instability, loss of shelter or food insecurity. Thus analyzing shifts in precipitation patterns across different regions and time periods is vital to understanding their impact on the environment, society, and the economy.
Research questions
What are the characteristics of extreme precipitation events in different regions of India, and how do they evolve over time with respect to the topography of various areas?
How does the observed precipitation dataset (IMD rain gauge data) compare with CHIRPS data in capturing long-term precipitation variability in India?
Review of literature
Previous studies exhibit a lack of consensus over the trends of average rainfall and extreme events in India (Malik et al. (2016), Ghosh et al. (2011)). With our study, we aim to gain insight into the prevailing uncertainty about the average rainfall, extremes and seasonality of the ISM, a phenomenon that contributes significantly to the socioeconomic well-being of the region (Gadgil & Gadgil (2006), Falga & Wang (2022)). The findings of this study may have the potential to inform flood hazard preparedness, water management, and related climate policies.
Methodology
Identification of Extreme Events
This study conducted a comprehensive analysis of extreme precipitation events in India using IMD station data spanning 1901 to 2022. The dataset underwent meticulous preprocessing to ensure reliability. Time series plots were generated to illustrate temporal patterns of extreme rainfall events.
Calculated the 99th percentile daily precipitation for all Indian locations from 1901 to 2022.
Identified extreme precipitation events by comparing daily values to the defined threshold.
Temporal Analysis
The assessment of trends in extreme precipitation involved the application of the Mann-Kendall test, renowned for its sensitivity to monotonic trends.
Regional Analysis
Four distinct regions—Northwest India (NWI), Northeast India (NEI), Central India, and Southern Peninsular India (SPIN)—were identified based on geographical and climatic considerations. The Mann-Kendall test was applied to discern trends in extreme precipitation, providing insights into consistent increases or decreases over time. Spatial analyses focused on identifying regions highly prone to extreme events.
CHIRPS vs IMD dataset comparison
In an additional facet of the study, active and break spells of the monsoon were calculated using data from the Indian Meteorological Department (IMD), Integrated Multi-Satellite Retrievals for Global Precipitation Measurement (IMERG), and Climate Hazards Group InfraRed Precipitation with Station data (CHIRPS). The focus of this analysis was on the years 2000 to 2020, allowing for a comparative assessment of the three datasets.
Implications
Provided recommendations for future research or policy actions based on the analysis.
Results
Temporal Analysis
The Mann-Kendall trend analysis revealed a positive trend value of approximately 0.0302 and a highly significant p-value of 0.00. This indicates a positive monotonic trend in extreme precipitation over time. The statistical significance (p-value of 0.00) allows for the rejection of the null hypothesis, confirming the presence of a significant increasing trend in extreme precipitation events. We used the Mann-Kendall test to analyze trends in extreme rainfall events. This non-parametric method detects monotonic trends in time series data without assuming any specific data distribution, making it ideal for environmental datasets where distributions may deviate from normality.
Spatial Analysis
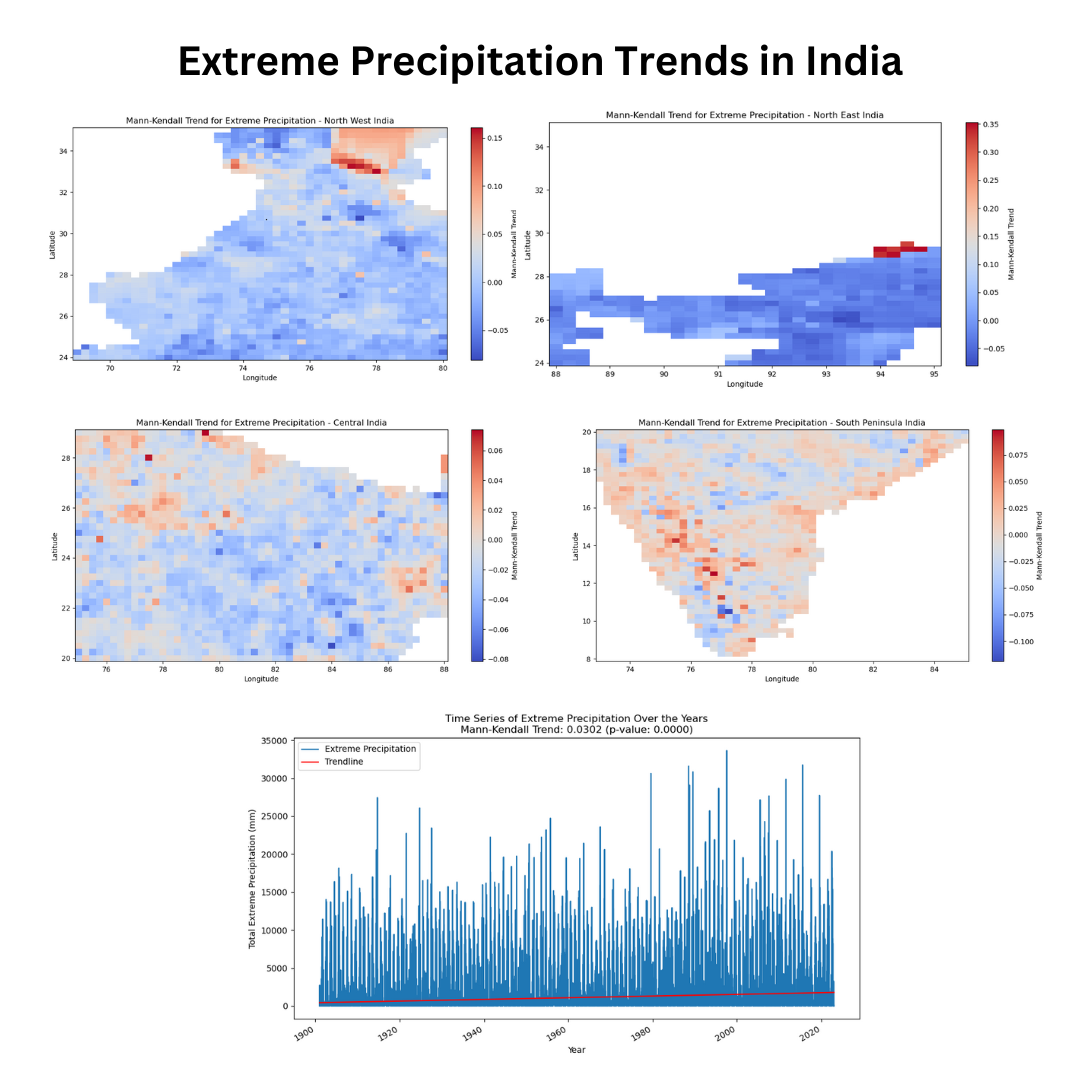
Figure 2:Mann-Kendall Trend Analysis for Extreme Precipitation Across Indian Regions (1901-2022). The figure presents spatial distribution maps showing Mann-Kendall trend statistics for extreme precipitation events across four major regions of India: Northwest India (top left, scale -0.05 to 0.35), Northeast India (top right, scale -0.5 to 0.35), Central India (bottom left, scale -0.08 to 0.06), and Southern Peninsular India (bottom right, scale -0.100 to 0.075). The color gradients represent trend values, with warmer colors (red/orange) indicating positive trends (increasing extreme precipitation) and cooler colors (blue) indicating negative or less pronounced trends. The fifth panel (center) shows the temporal evolution of extreme precipitation events from 1901 to 2023 with a fitted trend line, demonstrating the overall increasing pattern in extreme precipitation frequency across India. The spatial resolution is based on IMD station data with a 0.25 x 0.25 degree grid.
Positive trends in extreme rainfall were observed across all regions, showcasing an overall increase in extreme events. Variations in intensity and variability were noted among regions, with Northeast and Southern Peninsular India displaying more diverse trends. Northwest and Central India experienced a more pronounced increase, particularly in areas with warmer color values.
Spatial Analysis by Region:
Northwest India:
Observation: The color scale ranging from -0.05 to 0.35 indicates a generally positive trend in extreme rainfall.
Interpretation: Northwest India is experiencing an overall increase in extreme rainfall events. Areas with warmer colors, closer to 0.35, demonstrate a more pronounced upward trend.
Northeast India:
Observation: The color scale ranges from -0.5 to 0.35 with an interval of 0.10, suggesting a diverse range of trends.
Interpretation: Northeast India shows variability in extreme rainfall trends. Areas with warmer colors (closer to 0.35) exhibit a more substantial increase, while cooler colors (closer to -0.5) suggest a less pronounced upward trend.
Central India:
Observation: The color scale ranges from -0.08 to 0.06, indicating a range of positive trends.
Interpretation: Central India demonstrates an overall positive trend in extreme rainfall. Areas with warmer colors, closer to 0.06, show a more significant increase, while those with cooler colors, closer to -0.08, exhibit a less pronounced upward trend.
Southern Peninsular India:
Observation: The color scale ranges from -0.100 to 0.075, showing a diversity of trends.
Interpretation: Southern Peninsular India reveals variability in extreme rainfall trends. Warmer colors (closer to 0.075) signify a more substantial increase, while cooler colors (closer to -0.100) suggest a less pronounced upward trend.
Comparison: CHIRPS vs IMD dataset
CHIRPS is satellite-based precipitation data, calibrated with ground-based data which extends into both hemispheres, 50 degrees North and South, this data set is available from 1981-2020 and the rainfall is assessed in mm for which the spatial resolution is 0.05 x 0.05 degree (5500 meters). The IMD rainfall dataset has a spatial resolution of 0.25 x0.25 degrees and is available from 1901 to 1923.
Intraseasonal activity (Indian summer monsoon)
The Indian summer monsoon (ISM) exhibits intraseasonal activity characterized by alternating active and break phases. Our study applied the criteria by Rajeevan et al. (2010) for identifying these phases. Break spells, marked by normalized rainfall anomaly consecutively less than -1.0 for three days or more, were contrasted with active spells, where the anomaly exceeded +1.0. A comparative analysis of IMD, CHIRPS, and IMERG datasets from 2000 to 2020 revealed variations in identifying these spells. IMD identified 24 active and 20 break spells, CHIRPS identified 30 active and 26 break spells, while IMERG identified 44 active and 56 break spells. These findings underscore the dataset-dependent variations in recognizing intraseasonal activity during the ISM.
Conclusion
The analysis shows a positive overall slope from 1901 to 2022, indicating a gradual increase in extreme precipitation events in India, with a modest rate of roughly 0.0052% per year. The steeper positive trend in recent years may indicate evolving climate patterns, potentially influenced by global climate change (from prelimnary results). The spatial analysis highlights regional variations in extreme rainfall trends, emphasizing the need for tailored climate adaptation strategies. The spatial analysis indicates positive trends in extreme rainfall across all regions, aligning with the overall increase observed in the temporal analysis. The identification of active and break spells contributes to understanding the monsoon dynamics, crucial for effective climate risk mitigation. Overall, the study provides valuable insights into the changing precipitation patterns in India, facilitating informed decision-making for climate resilience and disaster management.
Recommendations
Early warning systems: based on our research, we concluded that it is essential to have good early warning systems that could mitigate possible climate risks in terms of loss of damage to life, livestock, agricultural land and property.
Infrastructure development and community management policies: in light of severe extreme events, it is also essential to build policies that integrate the community and promote infrastructure that could withstand damage. Currently, severe extreme events lead life to be on a standstill, therefore climate adaptation strategies need to be thought through.
Further research and development: more accurate systems of research are needed that explore the specific impacts of extreme precipitation on different sectors such as agriculture, land management, forestry and more.
- Malik, N., Bookhagen, B., & Mucha, P. J. (2016). Spatiotemporal patterns and trends of Indian monsoonal rainfall extremes. Geophysical Research Letters, 43(4), 1710–1717. 10.1002/2016gl067841
- Ghosh, S., Das, D., Kao, S.-C., & Ganguly, A. R. (2011). Lack of uniform trends but increasing spatial variability in observed Indian rainfall extremes. Nature Climate Change, 2(2), 86–91. 10.1038/nclimate1327
- Gadgil, S., & Gadgil, S. (2006). The Indian Monsoon, GDP and Agriculture. Economic and Political Weekly, 41(47), 4887–4895. https://www.jstor.org/stable/4418949
- Falga, R., & Wang, C. (2022). The rise of Indian summer monsoon precipitation extremes and its correlation with long-term changes of climate and anthropogenic factors. Scientific Reports, 12(1). 10.1038/s41598-022-16240-0
- Rajeevan, M., Gadgil, S., & Bhate, J. (2010). Active and break spells of the Indian summer monsoon. Journal of Earth System Science, 119(3), 229–247. 10.1007/s12040-010-0019-4