Characteristics of historical Compound Flash Droughts and Heatwaves in Peru during 1981-2015
Abstract
Extreme climate events such as heatwaves, flash droughts, and compound events pose increasing risks to society under a changing climate. In this study, the spatiotemporal characteristics of Compound Flash Drought Heatwave (CFDHW) events were studied using high-resolution gridded datasets of precipitation, temperature, and potential evapotranspiration across Peru from 1981 to 2015. Compound events were defined as the co-occurrence of heatwaves and flash droughts in the same spatial location. Our results reveal strong geographic contrasts in the distribution of the extreme events. Heatwaves were frequent and persistent along the coast and in the northern Amazon basin. In contrast, flash droughts were more widespread and lasted longer in the central and southern parts of the Pacific basin. CFDHW events were less frequent by nature of detection, but showed clear clustering in coastal and northern Amazon regions, in accordance with the heatwaves. However, CFDHW events lasted longer at the coast and in the central Amazon basin. Interannual variability indicates that the severity of heatwaves and compound events peaked mainly during major El Niño episodes (e.g., 1982–83 and 1997–98), whereas flash drought severity showed several peaks, especially after 2000.
Introduction
Compound climate events are defined as combinations of multiple drivers and/or hazards that jointly contribute to societal or environmental risk (Zscheischler et al. (2018)). The evolution of droughts and heatwaves is significantly influenced by positive land–atmosphere feedbacks between these extreme events (Marengo et al. (2025); Miralles et al. (2019); Rouges et al. (2023)), and should be analyzed as compound events rather than individual events (Zscheischler & Seneviratne (2017)). A core challenge is to analyze both hazards on comparable timescales, since heatwaves typically last for several days to a few weeks (Miralles et al. (2019)), whereas classical droughts develop at the scale of months (Stagge et al. (2015)), making it hard to understand the combined effects of co-occurring hazards. Here, we consider a special form of drought characterized by rapid onset and short duration referred to as flash drought (Oikonomou et al. (2020); Lisonbee et al. (2021)). In Peru, only a handful of reports on either heatwaves or droughts are available (Gálvez (2018); Quispe-Vega et al. (2015); Vega-Jacome & Lavado-Casimiro (2015); Zubieta et al. (2021); Ruedas et al. (2023)), and none of them has analyzed droughts at a comparable timescale as heatwaves. Regarding compound drought and heatwave events, only particular past events were analyzed. Here, we aim to characterize the spatiotemporal pattern of the compound flash drought and heatwave (CFDHW) events during the climatological period from 1981 to 2015 in Peru.
Material and methodology
Study area
Peru, located in the central and western region of South America, extends from 0°02’ N to 18°21’ S in latitude and 81°19’ W to 68°39’ W in longitude. From east to west, the Andes divide the territory into a desert coastal region to the west and the Amazon basin to the east, with elevations ranging from sea level to 6,768 m at Huascarán glacier. The complex topography of Andes induces strong hydroclimatic variability across multiple spatial and temporal scales (Arias et al. (2021); Espinoza et al. (2015); Casimiro et al. (2012)). Due to its complex hydroclimatology, precipitation distribution varies significantly both latitudinally (north-south) and longitudinally (east-west), shaping diverse climatic conditions. These range from the arid and warm coastal region to the temperate, frigid, and polar inter-Andean valleys, and the warm and humid Amazon rainforest.
Data
To identify heatwaves and flash droughts, we used high-resolution gridded long-term historical daily climate data from 1981 to 2015, including precipitation, maximum and minimum temperature, and potential evapotranspiration data (Table 1). Since the variables were obtained at different spatial resolutions, regridding and clipping were performed to standardize the grid resolution and the spatial extent. Additionally, a shape file of the country was applied to exclude data outside Peruvian territory.
Methodology and Tools
First, heatwaves and flash droughts were identified separately at a comparable timescale. Heatwaves were detected using a joint Tmax and Tmin criterion, where both must exceed the corresponding 90th percentile of the reference period (1981–2010), with the default detection based on 5-day rolling means, and such an event must last for at least 3 consecutive days (Fu & Wang (2022)).
Table 1:Description of climate products used in the analysis
Climate variable | Name of product | Time period | Spatial resolution | Temporal resolution | Reference |
|---|---|---|---|---|---|
Precipitation | RAIN4PE - Rain for Peru and Ecuador | 1981–2015 | 0.1° | daily | |
Temperature (Tmax, Tmin) | SENAMHI - PISCOt v1.2 | 1981–2020 | 0.01° | daily | |
Potential Evapo- transpiration (PET) | Penman-Monteith ETo dataset (PISCOeo_pm) | 1981–2016 | 0.01° | daily |
To identify flash droughts, the standardized precipitation evapotranspiration index was estimated with a window size of five days (pentad-SPEI) using the daily precipitation data from the RAIN4PE product and daily potential evapotranspiration (PET) data. In contrast to contemporary studies, we estimated the pentad-SPEI in a way similar to the rolling average to ensure comparability with the smoothed daily temperature data, i.e. pentad-SPEI was estimated daily instead of every five days. A large negative SPEI value indicates dry conditions, while a large positive SPEI indicates wet conditions. Adapted from Fu & Wang (2022), our daily pentad-SPEI values were converted to percentiles, and a flash drought was detected based on the following rules:
a daily pentad-SPEI drops below the 40th percentile (onset threshold) and continues to drop below the 20th percentile (detection threshold),
from the onset to the minimum, no more than one pentad has a decline rate < 5 percentiles,
a minimum duration of 3 pentads, i.e. 15 days, is observed before the daily pentad-SPEI recovers to >=20th percentile (offset threshold),
a minimum duration of 1 pentad, i.e. 5 days, is observed with the daily pentad-SPEI <= 20th percentile, and
the mean daily pentad-SPEI from the onset to the offset is <= 30th percentile.
The CFDHW events were defined as the temporal co-occurrence of heatwaves and flash droughts (Figure 1 a). A compound event was identified whenever at least one day of overlap occurred between a FD and a HW event at a given grid cell. For every FD–HW event pair, the potential overlap period was defined by taking the later of the two start dates and the earlier of the two end dates, and a pair was identified as a CFDHW event when the overlap start occurred on or before the overlap end. Overlap_start = max(FD start, HW start) overlap _end = min (FD end, HW end) CFDHW event = overlap_start ≤ overlap_end. Each overlapping FD-HW pair was treated as an independent compound event. Therefore, one FD overlapping multiple short HWs (or vice versa) were counted as multiple CFDHW events, for example.
Heatwaves, flash droughts, and compound events were all characterized in terms of the number of events, annual frequency, and mean duration. CFDHW event metrics were computed strictly over the overlap period only, irrespective of whether the HW or FD begins earlier or ends later than the other. Additionally, we quantify the severity of each extreme event as follows:
Heatwave severity is the cumulative exceedance of smoothed maximum temperature above its 90th percentile threshold; flash drought severity is the cumulative deficit of pentad-SPEI below the 40th percentile; an empirical compound intensity index over the overlap window, proposed by Alizadeh et al. (2020), was used as a proxy to compound event severity during the overlap period between heatwaves and flash droughts. Although this indicator has some limitations in terms of physical interpretability, it provides a useful approximation of the overall intensity of compound events.
Result
The spatial patterns of extreme climate events revealed clear geographic contrasts across Peru (Figure 1 c). Heatwaves were more frequent and had longer durations along the coast. In the northern Amazon basin, although the heatwaves were frequent, their durations were much shorter than in the coastal regions. This suggests persistent and recurrent thermal stress in these areas, likely influenced by arid coastal conditions and ocean–atmosphere interactions. In contrast, the Andes region (highlands) exhibited comparatively fewer and shorter heatwaves., This may reflect the combined influence of elevation, complex topography, and high-altitude climate conditionsThis which could be explained by the regulating effect of the high altitudes and the glaciers on the minimum temperatures. Flash droughts displayed a broader and more spatially uniform pattern than heatwaves, with higher frequency along the Pacific and Titicaca basin, and higher durations mainly in the center and the south of the Pacific basin. Flash droughts lasted substantially longer (16–26 days) than heatwaves (3–17 days), indicating sustained moisture deficits once drought conditions are triggered. The southern regions, already prone to water scarcity, were especially vulnerable to repeated drought stress. Compound FDHW events, defined by the co-occurrence of heatwaves and flash droughts, were less frequent overall, but displayed clustering in coastal and parts of the north Amazon basin of Peru. In central Peru, compound events lasted longer but occurred less frequently compared to other parts of Peru.
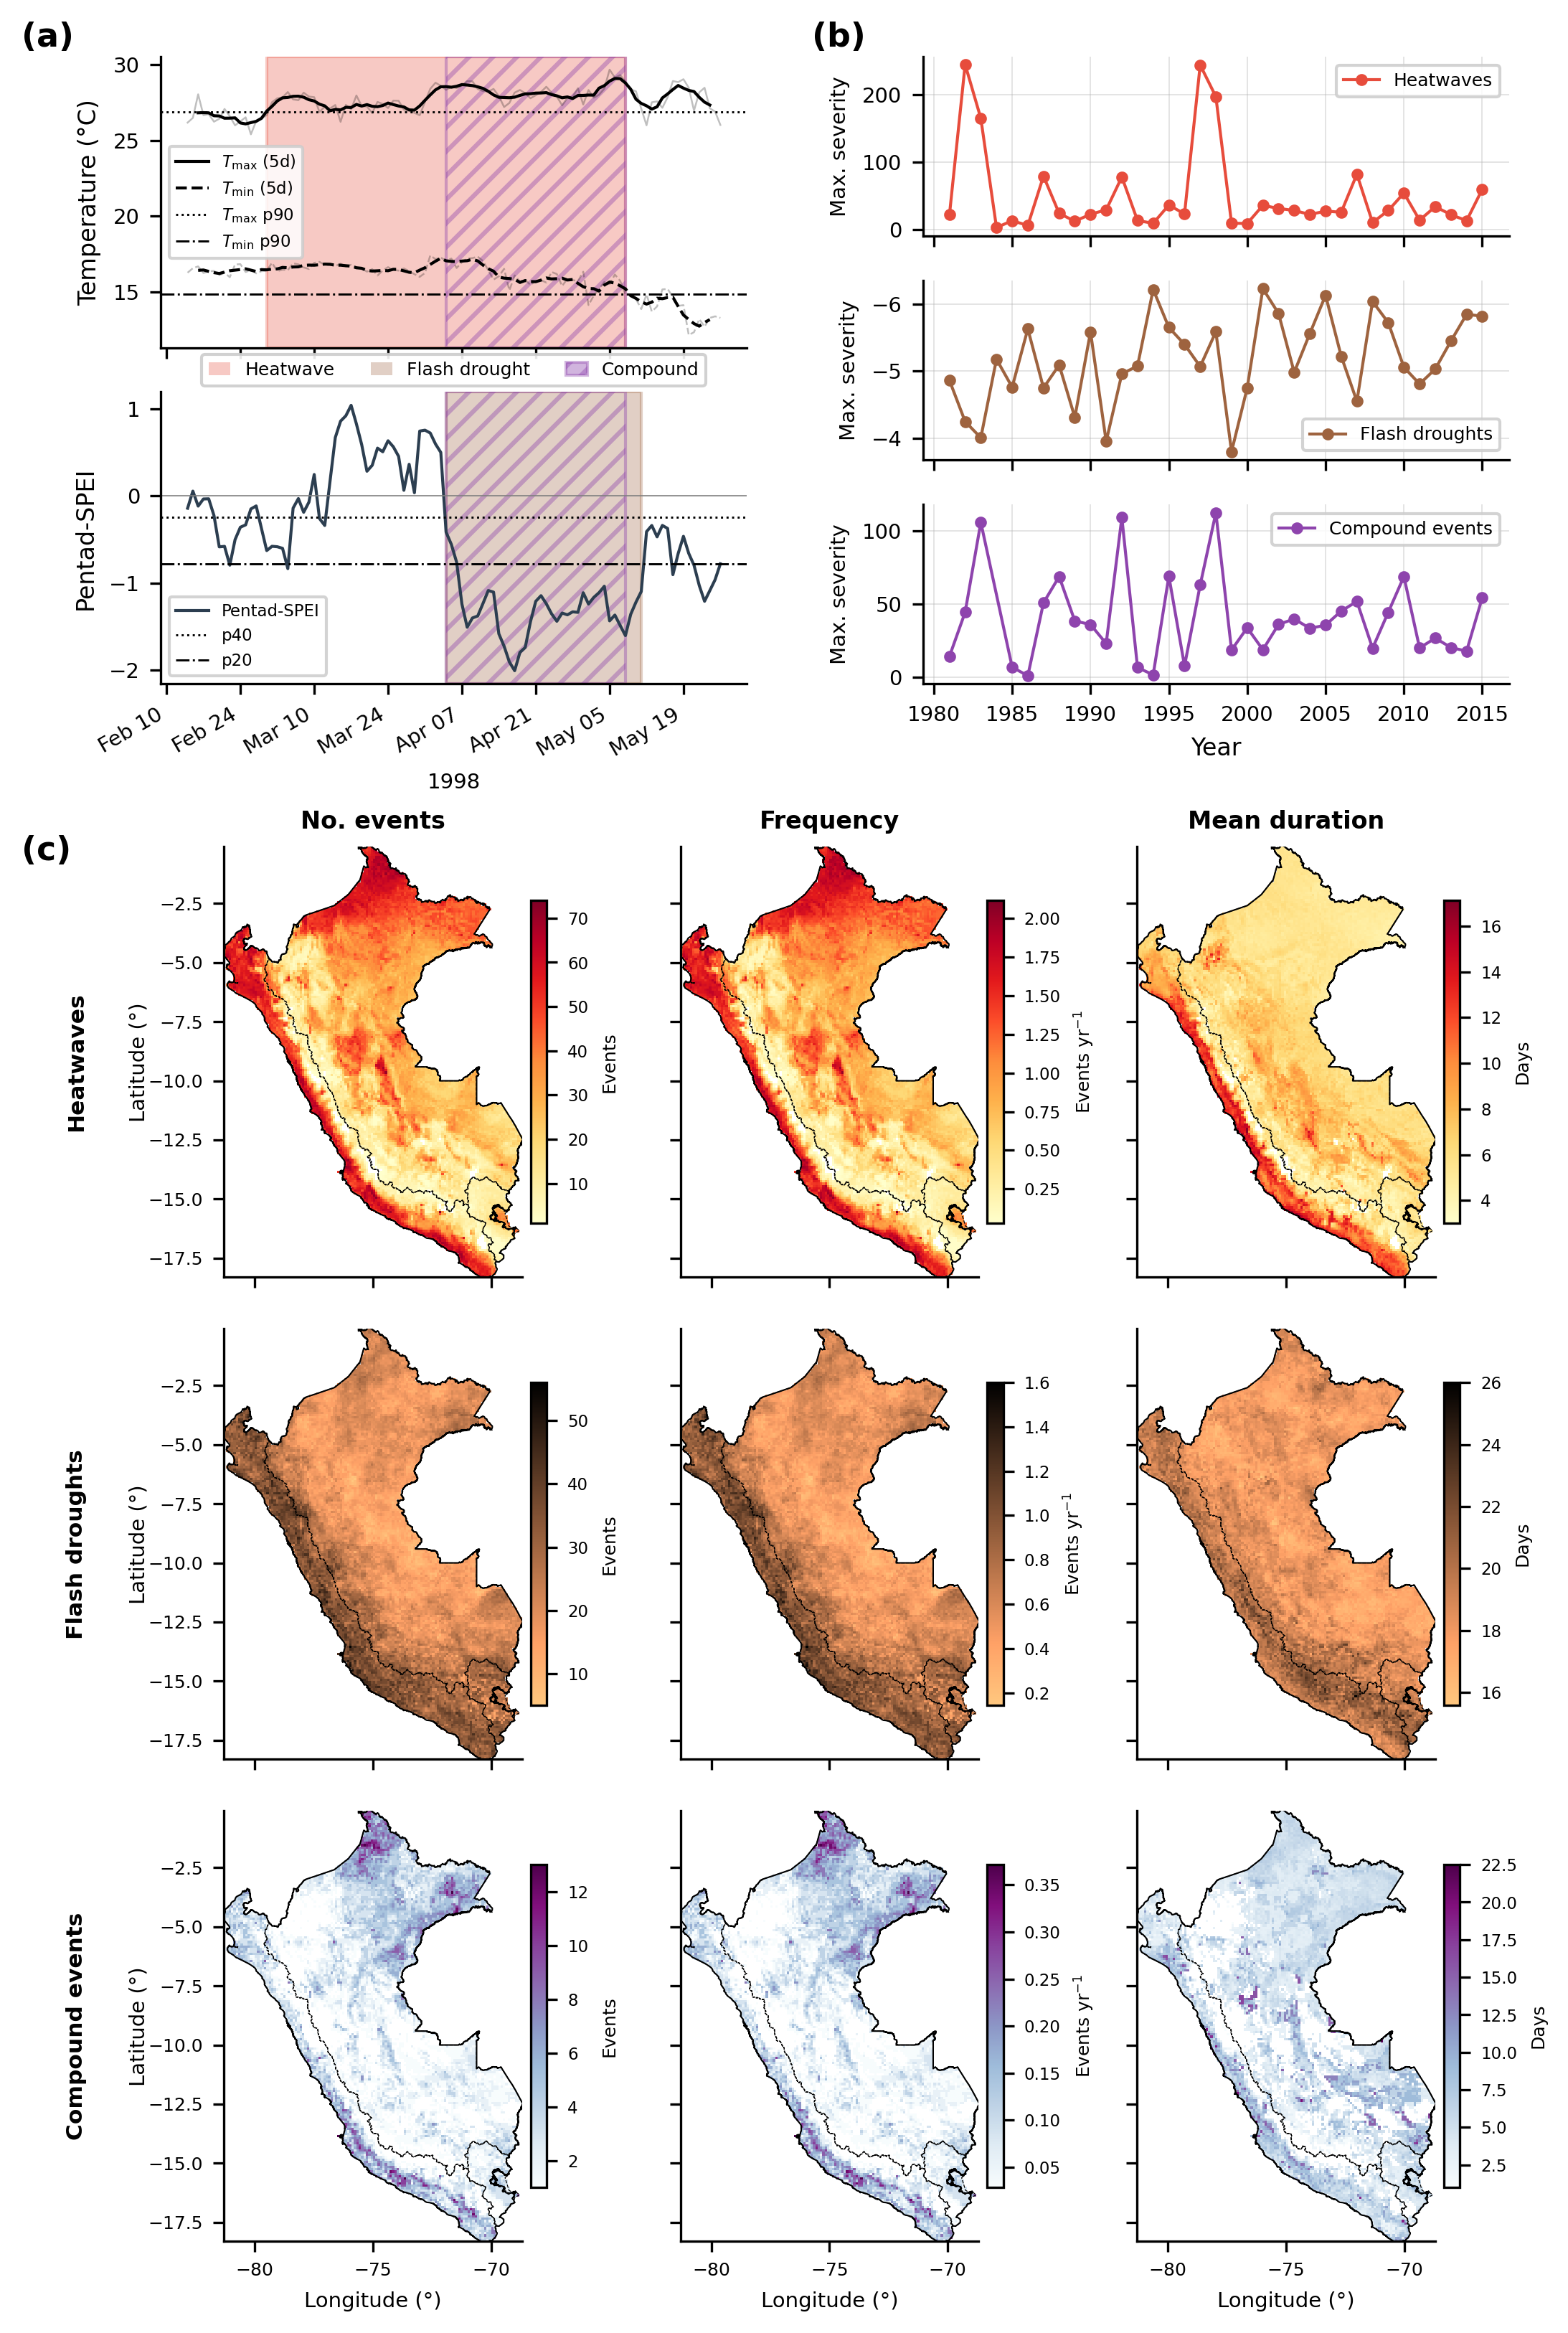
Figure 1:Compound flash droughts and heatwaves across major hydrological basins in Peru (1981–2015).
a. Example detection of a compound event at a single pixel during 1998, showing daily maximum and minimum temperatures smoothed using a moving window of 5 days (top) and daily pentad-SPEI (bottom). Heatwaves (red shading) and flash droughts (brown shading) are detected using the respective thresholds expressed as the N-th percentiles (horizontal lines) in accordance with Fu & Wang (2022); compound events (purple hatched shading) are periods of temporal overlap between concurrent heatwave and flash drought events.
b. Annual maximum severity of heatwaves (top, red), flash droughts (middle, brown; y-axis inverted because the severity values are negative), and compound events (bottom, purple) across Peru over the study period.
c. Spatial distribution of event characteristics across Peru: total number of events (left), mean annual frequency (center), and mean duration in days (right) for heatwaves (top row), flash droughts (middle row), and compound events (bottom row). Black solid lines show the national boundary; dashed lines delineate the three major hydrographic watersheds (Pacific, Atlantic, and Titicaca).
The spatial patterns of heatwaves, flash droughts, and compound events in Peru reflect the country’s main hydroclimatic regimes. Heatwaves are more frequent and persistent along the coast, likely driven by atmospheric subsidence, reduced cloud cover, and ENSO-related warming, whereas their lower persistence in the Andes may be related to strong diurnal temperature ranges, complex topography, and frequent air mass changes that moderate extreme temperature persistence. Flash droughts are more frequent and longer-lasting in the coastal and Pacific basins, where high evaporative demand, low precipitation intermittency, and strong radiative forcing favor rapid development of atmospheric water deficits. In the Titicaca basin, their dynamics are additionally shaped by strong seasonality and abrupt precipitation interruptions, with slow recovery of the regional water balance. Compound heatwave–flash drought events cluster along the coast and northern Amazon, reflecting different but complementary mechanisms: water-limited conditions and strong radiative forcing in the coastal region, and episodic reductions in convection and moisture recycling in the Amazon that enhance shortwave radiation and promote concurrent warming and drying.
Next, we examined the temporal variability of extreme climate events across the reporting period (1981–2015). The highest severity of extreme events showed pronounced interannual variability across all event types (Figure 1 b). Flash drought severity remained relatively stable within a narrow range of negative values, exhibiting frequent year-to-year fluctuations suggesting increasing severity mainly since the 2000s. Notably, no consistent signal of enhanced severity was observed even during major El Niño years (1982-83, and 1997-98). El Niño events exert contrasting hydroclimatic effects along the longitudinal axis of Peru, i.e., while northern regions typically experience increased precipitation, southern regions often undergo drying. The maximal severity alone was likely insufficient to reflect the effect of El Niño on flash droughts. In contrast, heatwave severity shows stronger interannual variability, with the highest peaks occurring during major El Niño episodes (particularly in 1982-83, and 1997-98). This pattern suggests prolonged and intensified warm conditions across large parts of the country during these periods, reflected in both increased amplitude and duration of heatwaves. Compound events also show episodic behaviour, with several pronounced peaks that generally coincide with moderate to high severity heatwave years. This suggests that compound FDHW extremes are primarily driven by periods of enhanced thermal stress, with concurrent land–atmosphere feedbacks likely amplifying drought conditions during warm extremes. Like in the case of the compound FDHW event of 1998 over the south of the Pacific basin (Figure 1 a), where the heatwave event started at the beginning of March, followed by a flash drought starting in April, lasting until May. This temporal evolution is consistent with the possibility that antecedent atmospheric forcing initiates the heat extreme, while subsequent land–atmosphere coupling may contribute to the persistence and intensification of drought conditions. Future work could therefore investigate the relative roles of large-scale advection and local land–atmosphere feedbacks in driving the changes in compound FDHW extremes identified here.
Conclusion
This study analyses the spatio-temporal dynamics of compound flash drought–heatwave (CFDHW) events across Peru, revealing pronounced regional contrasts and clear temporal variability. Heatwaves were more frequent along the Pacific coast and in the northern Amazon, whereas flash droughts were more frequent and persistent in the Pacific and Titicaca basins. Consequently, compound events exhibited regional clustering, particularly in the coastal and northern Amazon regions. CFDHW severity showed pronounced inter-annual variability with peaks during major El Niño events and higher variability before 2000. These compound events typically evolved through an initial phase of intensified heatwaves, followed by the onset of flash drought conditions. The pentad-based approach improved the representation of co-occurring extremes by better capturing their temporal alignment while smoothing short-term variability.
Focusing on co-occurring extremes provides a clearer understanding of region-specific risks associated with compound events. Combined heat and dryness is most pronounced along the arid Pacific coast, where agricultural systems and water resources are particularly vulnerable. The southern regions experience prolonged drought impacts, while the northern Amazon is exposed to recurring heat extremes that may increase the risk of forest fires in this region. The Andes, although relatively less exposed to prolonged heatwaves, remain sensitive due to their dependence on cryospheric and high-altitude climate regulation. Together, these spatial contrasts highlight that compound extremes do not impact Peru uniformly, but instead pose region-specific risks that require targeted adaptation and management strategies. However the analysis is limited to identifying temporal co-occurrence and does not assess statistical dependence, causality, or land–atmosphere feedback mechanisms. Future studies could address this limitation using copula-based dependence modelling, conditional probability approaches, or event coincidence analysis to better resolve potential interactions between the two hazards.
Acknowledgments
This work was supported by the Impact Scholars Program. We acknowledge the contributions of Nkongho Ayuketang Arreyndip, and Viviana Greco.
Data Availability
Published via Impact Scholars; original development repository.
- Zscheischler, J., Westra, S., Hurk, B. J. J. M. V. D., Seneviratne, S. I., Ward, P. J., Pitman, A., Aghakouchak, A., Bresch, D. N., Leonard, M., Wahl, T., & Zhang, X. (2018). Future climate risk from compound events. Nature Climate Change, 8(6), 469–477. 10.1038/S41558-018-0156-3
- Marengo, J. A., Costa, M. C., Cunha, A. P., Espinoza, J. C., Jimenez, J. C., Libonati, R., Miranda, V., Trigo, I. F., Sierra, J. P., Geirinhas, J. L., Ramos, A. M., Skansi, M., Molina-Carpio, J., & Salinas, R. (2025). Climatological patterns of heatwaves during winter and spring 2023 and trends for the period 1979–2023 in central South America. Frontiers in Climate, 7. 10.3389/fclim.2025.1529082
- Miralles, D. G., Gentine, P., Seneviratne, S. I., & Teuling, A. J. (2019). Land–atmospheric feedbacks during droughts and heatwaves: state of the science and current challenges. Annals of the New York Academy of Sciences, 1436(1), 19–35. 10.1111/nyas.13912
- Rouges, E., Ferranti, L., Kantz, H., & Pappenberger, F. (2023). European heatwaves: Link to large-scale circulation patterns and intraseasonal drivers. International Journal of Climatology, 43(7), 3189–3209. 10.1002/joc.8024
- Zscheischler, J., & Seneviratne, S. I. (2017). Dependence of drivers affects risks associated with compound events. https://www.science.org
- Stagge, J. H., Tallaksen, L. M., Gudmundsson, L., Loon, A. F. V., & Stahl, K. (2015). Candidate Distributions for Climatological Drought Indices (SPI and SPEI). International Journal of Climatology, 35(13), 4027–4040. 10.1002/joc.4267
- Oikonomou, P. D., Karavitis, C. A., Tsesmelis, D. E., Kolokytha, E., & Maia, R. (2020). Drought Characteristics Assessment in Europe over the Past 50 Years. Water Resources Management, 34(15), 4757–4772. 10.1007/s11269-020-02688-0
- Lisonbee, J., Woloszyn, M., & Skumanich, M. (2021). Making sense of flash drought: definitions, indicators, and where we go from here. Journal of Applied and Service Climatology, 2021(1), 1–19. 10.46275/JOASC.2021.02.001
- Gálvez, F. C. C. (2018). Olas de Calor en la Amazonia Peruana (pp. 1–149) [Phdthesis]. UNALM.
- Quispe-Vega, K., Alfaro-Lozano, L., Quispe-Gutierrez, N., & Castillo-Galvez, F. (2015). IDENTIFICACIÓN DE EVENTOS DE “OLAS DE CALOR” EN LA AMAZONÍA PERUANA (pp. 1–19) [Techreport]. SENAMHI-PERU. www.senamhi.gob.pe
- Vega-Jacome, F., & Lavado-Casimiro, W. (2015). Regionalizacion y caracterizacion de sequias en el Peru (pp. 1–33) [Techreport]. Peruvian Meteorological Service.
- Zubieta, R., Molina-Carpio, J., Laqui, W., Sulca, J., & Ilbay, M. (2021). Comparative analysis of climate change impacts on meteorological, hydrological, and agricultural droughts in the lake titicaca basin. Water (Switzerland), 13(2). 10.3390/w13020175
- Ruedas, D. P. R. A., Guerra, L. S., Popli, K., & Madaki, S. G. (2023). Spatio-Temporal Drought Assessment Using Standardized Precipitation Evapotranspiration Index (SPEI) over Mantaro Valley, Peru. Revista de Investigaciones Altoandinas - Journal of High Andean Research, 25(3), 159–170. 10.18271/ria.2023.525
- Arias, P. A., Garreaud, R., Poveda, G., Espinoza, J. C., Molina-Carpio, J., Masiokas, M., Viale, M., Scaff, L., & van Oevelen, P. J. (2021). Hydroclimate of the Andes Part II: Hydroclimate Variability and Sub-Continental Patterns. In Frontiers in Earth Science (Vol. 8). Frontiers Media S.A. 10.3389/feart.2020.505467
- Espinoza, J. C., Chavez, S., Ronchail, J., Junquas, C., Takahashi, K., & Lavado, W. (2015). Rainfall hotspots over the southern tropical Andes: Spatial distribution, rainfall intensity, and relations with large-scale atmospheric circulation. Water Resources Research, 51(5), 3459–3475. 10.1002/2014WR016273