Skip to article frontmatterSkip to article content
Site not loading correctly?

This may be due to an incorrect BASE_URL configuration. See the MyST Documentation for reference.

Supplementary Material — Bilateral hemispheric coupling is widespread but does not strictly predict choice encoding across the mouse brain

Authors
Affiliations
Neuromatch Academy, Neuromatch, Inc.
Neuromatch Academy, Neuromatch, Inc
Neuromatch Academy, Neuromatch, Inc.
McGovern Institute for Brain Research, MIT

Supplementary Figures

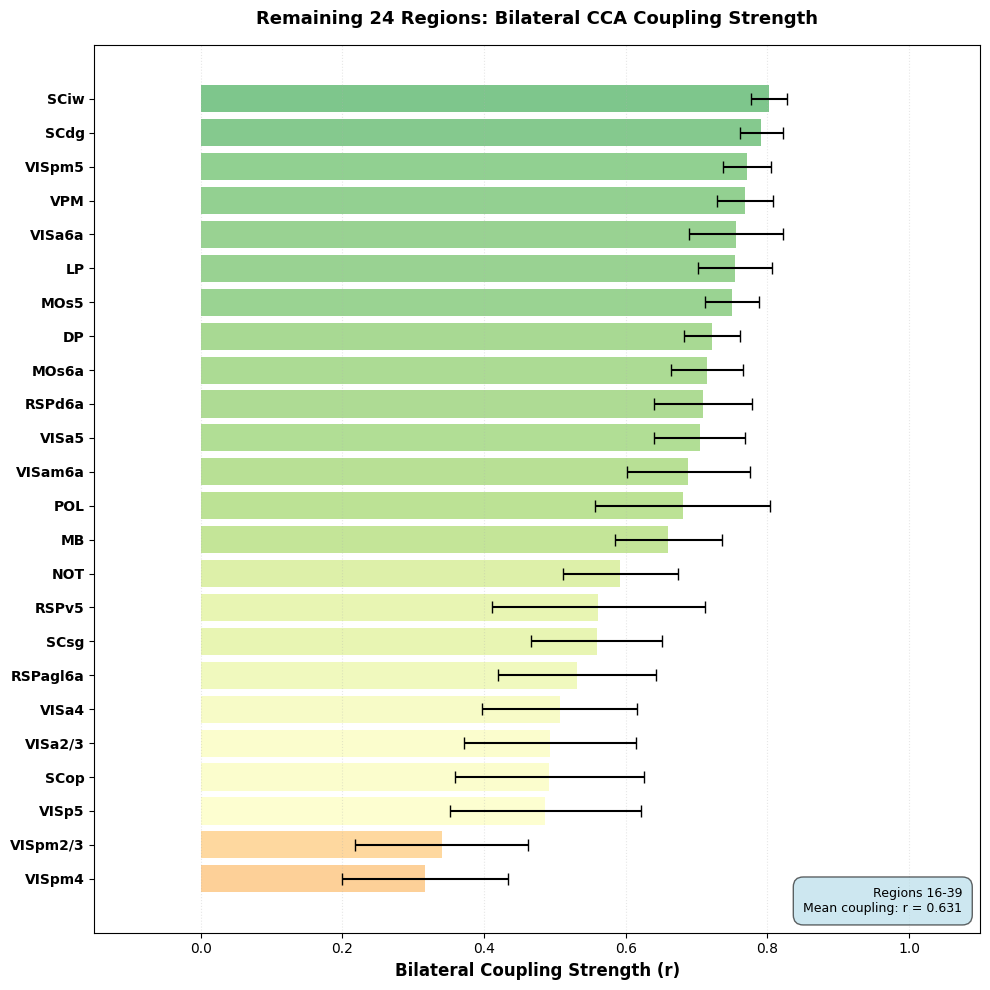
Bilateral CCA coupling strength for the remaining 24 brain regions (ranks 16–39). Bars show mean cross-validated peak canonical correlation (r_peak) per region, ranked by coupling strength. Error bars indicate 95% confidence intervals across sessions. Color gradient reflects coupling magnitude (green = stronger, yellow = moderate, orange = weakest). Mean coupling across these 24 regions is r = 0.631, substantially lower than the top 15 (r = 0.878; see main ). Visual cortex layers (VISpm4, VISpm2/3) show the weakest bilateral coupling in the dataset (r < 0.35), while deep superior colliculus layers (SCdg, SCiw) and thalamic nuclei (VPM, LP) maintain moderate coupling (r ≈ 0.75–0.80).
Supplementary 1:Bilateral CCA coupling strength for the remaining 24 brain regions (ranks 16–39). Bars show mean cross-validated peak canonical correlation (r_peak) per region, ranked by coupling strength. Error bars indicate 95% confidence intervals across sessions. Color gradient reflects coupling magnitude (green = stronger, yellow = moderate, orange = weakest). Mean coupling across these 24 regions is r = 0.631, substantially lower than the top 15 (r = 0.878; see main Figure 2). Visual cortex layers (VISpm4, VISpm2/3) show the weakest bilateral coupling in the dataset (r < 0.35), while deep superior colliculus layers (SCdg, SCiw) and thalamic nuclei (VPM, LP) maintain moderate coupling (r ≈ 0.75–0.80).

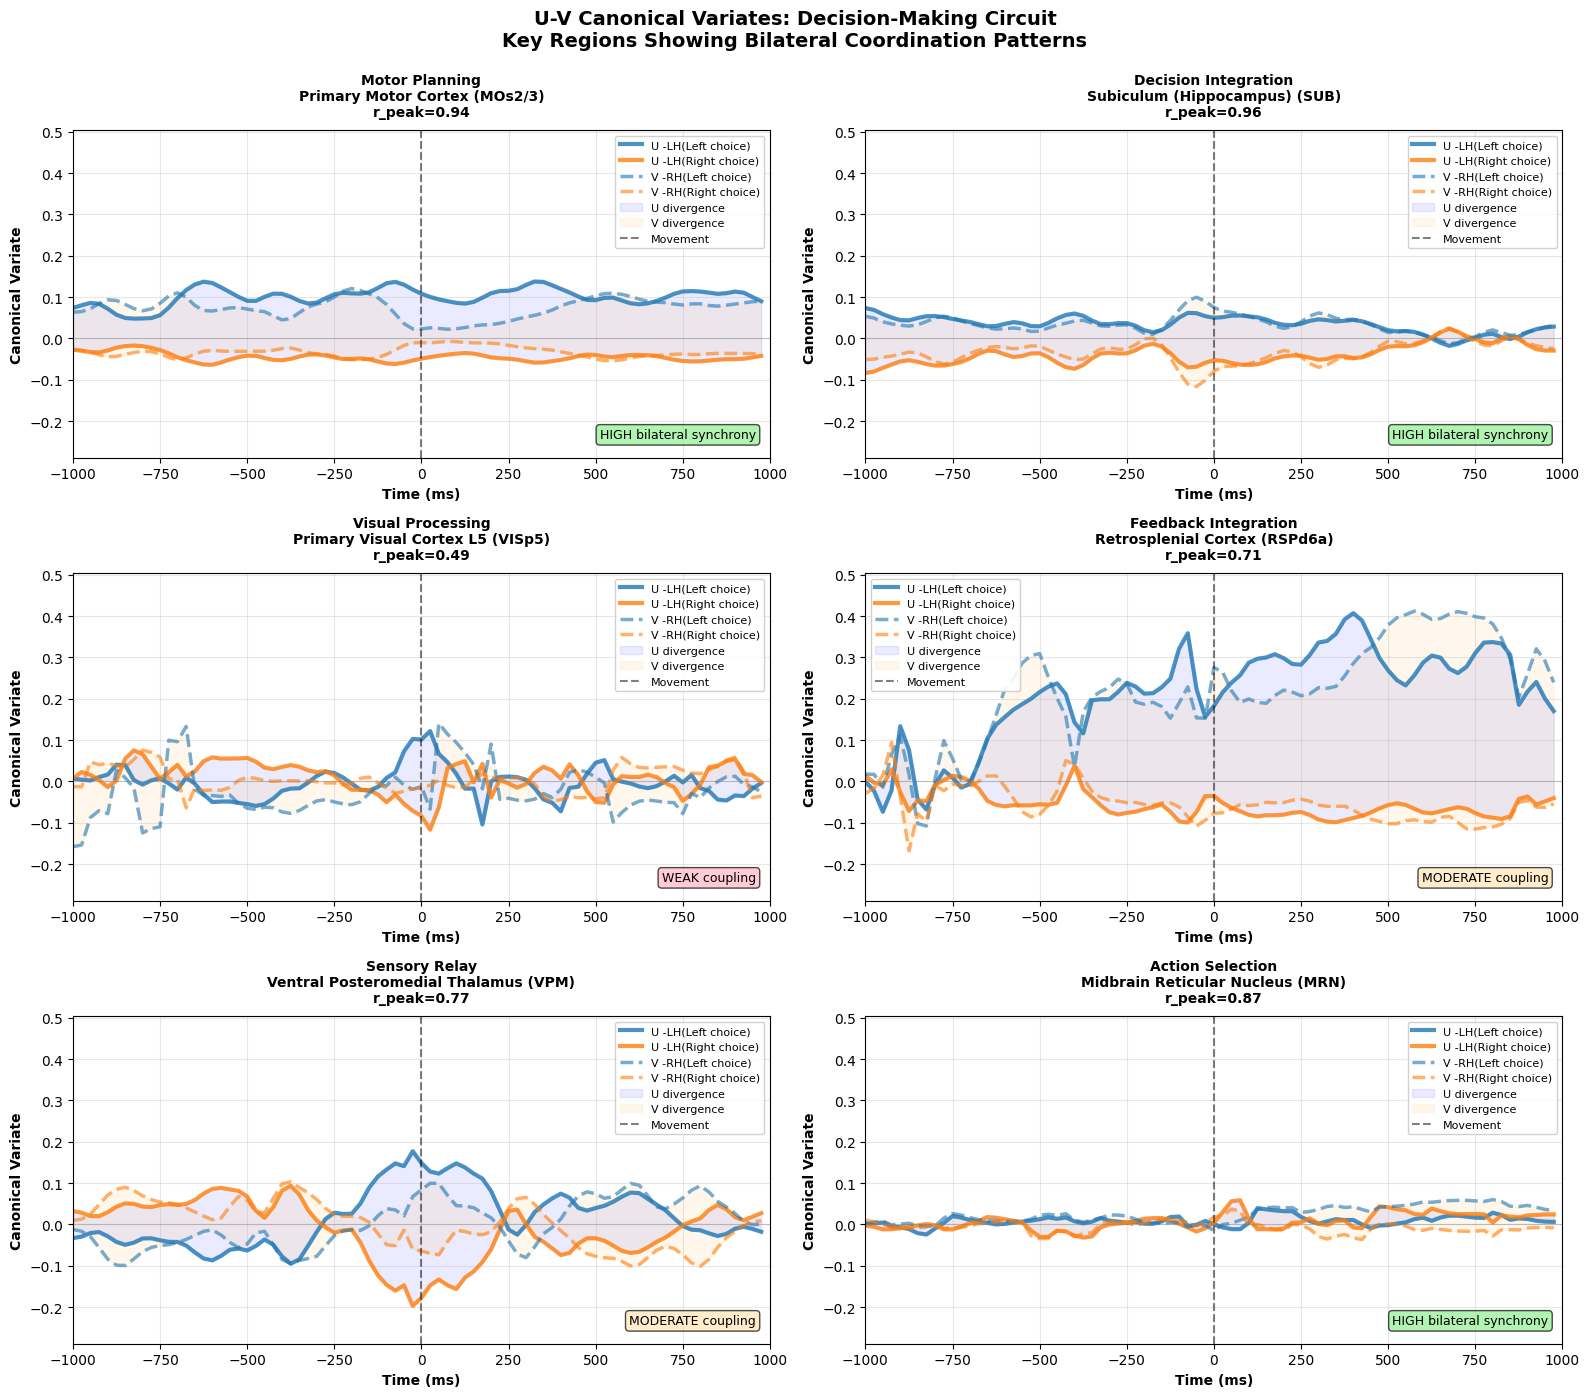
Trial-averaged left (U) and right (V) canonical variate time courses split by choice across representative regions, illustrating bilateral coupling regimes from synchronized motor cortex to weakly coupled visual cortex.
Supplementary 2:Trial-averaged left (U) and right (V) canonical variate time courses split by choice across representative regions, illustrating bilateral coupling regimes from synchronized motor cortex to weakly coupled visual cortex.

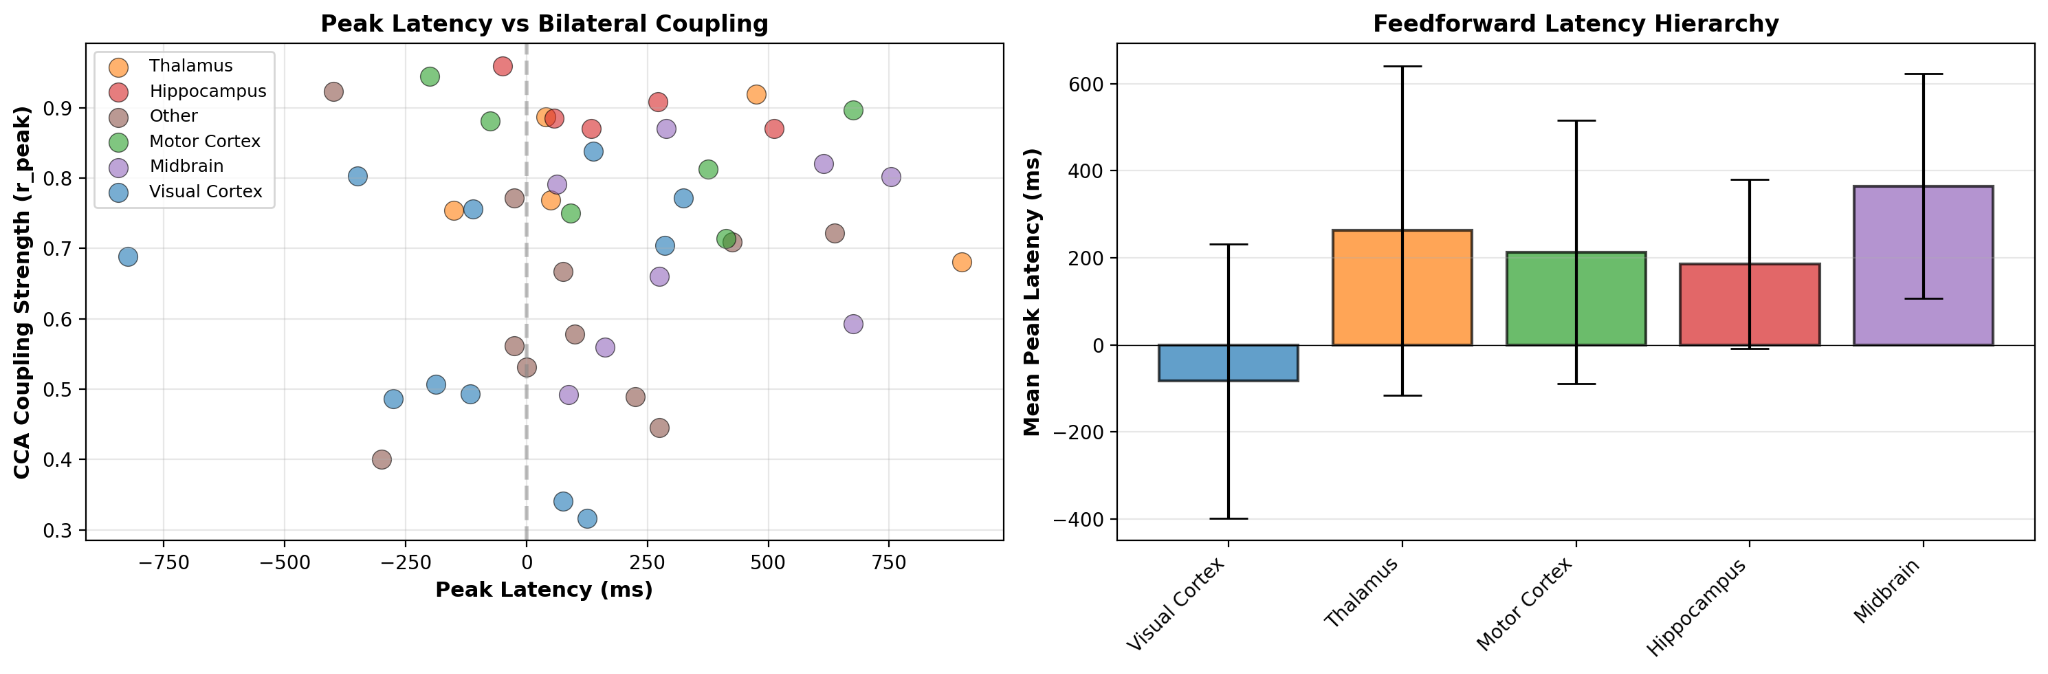
Peak choice-encoding latency versus bilateral coupling strength across regions, with mean latency by anatomical group revealing a feedforward hierarchy from visual cortex (earliest) through thalamus, motor cortex, and hippocampus to midbrain (latest).
Supplementary 3:Peak choice-encoding latency versus bilateral coupling strength across regions, with mean latency by anatomical group revealing a feedforward hierarchy from visual cortex (earliest) through thalamus, motor cortex, and hippocampus to midbrain (latest).

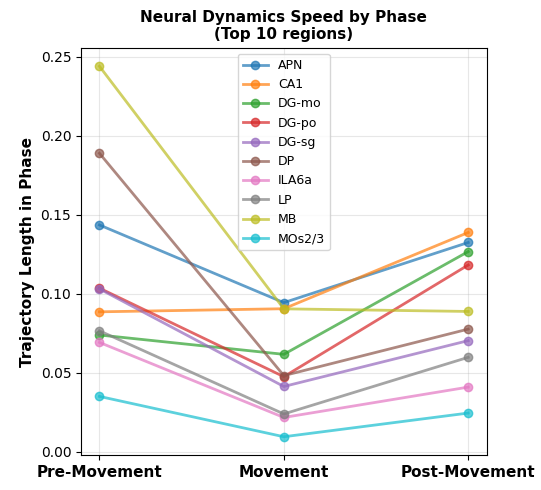
Phase-separated bilateral coupling metrics across pre-movement, movement, and post-movement trial phases. Trajectory length measures the path length traversed by the canonical variate in each phase (higher values = faster neural dynamics).
Supplementary 4:Phase-separated bilateral coupling metrics across pre-movement, movement, and post-movement trial phases. Trajectory length measures the path length traversed by the canonical variate in each phase (higher values = faster neural dynamics).

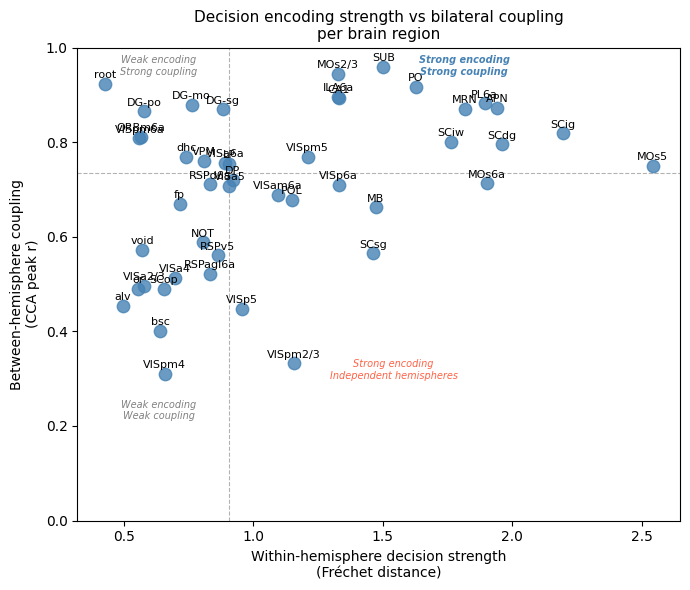
A 2D organizational space integrates within- and between-hemisphere encoding. Plotting within-hemisphere decision strength (Fréchet distance) against between-hemisphere coupling reveals four functional quadrants: strong encoding + strong coupling (PL6a, ILA6a, PO), strong coupling + weak encoding (hippocampal formation), strong encoding + independent hemispheres (MOs5, MOs6a), and weak in both.
Supplementary 5:A 2D organizational space integrates within- and between-hemisphere encoding. Plotting within-hemisphere decision strength (Fréchet distance) against between-hemisphere coupling reveals four functional quadrants: strong encoding + strong coupling (PL6a, ILA6a, PO), strong coupling + weak encoding (hippocampal formation), strong encoding + independent hemispheres (MOs5, MOs6a), and weak in both.

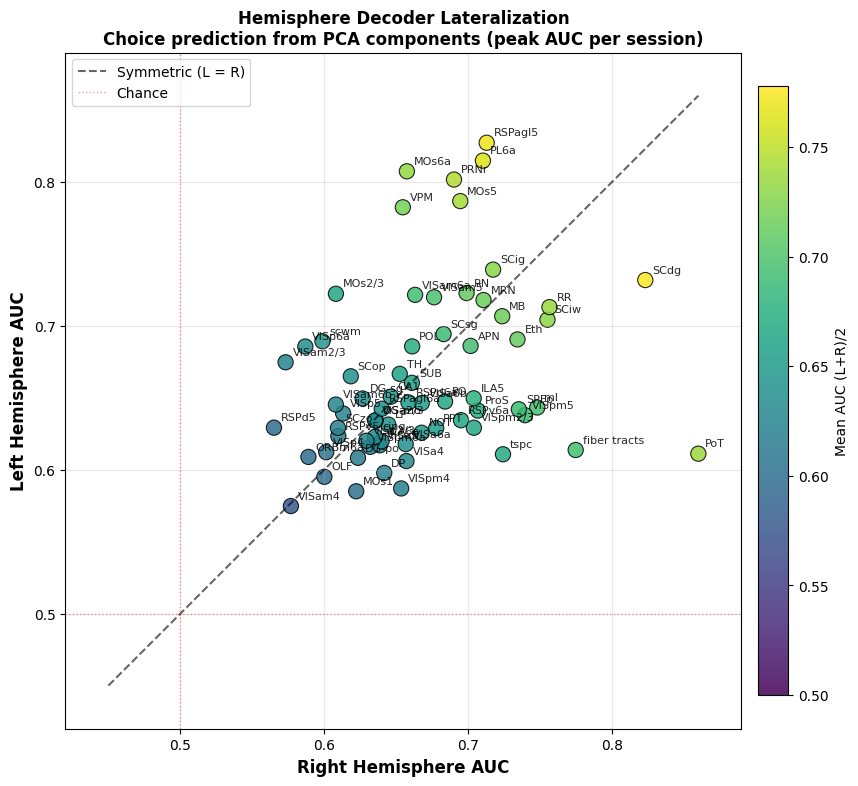
Independent population decoders confirm symmetric bilateral choice encoding. Logistic regression decoders were trained on the same PCA-reduced subspace as the CCA analysis (3 PCs per hemisphere, 5-fold cross-validation, peak AUC per session). Scatter of left-hemisphere AUC vs right-hemisphere AUC, one point per region (n = 67 regions sampled bilaterally). The clustering along the diagonal of bilateral symmetry confirms that both hemispheres decode choice with comparable accuracy across the brain.
Supplementary 6:Independent population decoders confirm symmetric bilateral choice encoding. Logistic regression decoders were trained on the same PCA-reduced subspace as the CCA analysis (3 PCs per hemisphere, 5-fold cross-validation, peak AUC per session). Scatter of left-hemisphere AUC vs right-hemisphere AUC, one point per region (n = 67 regions sampled bilaterally). The clustering along the diagonal of bilateral symmetry confirms that both hemispheres decode choice with comparable accuracy across the brain.

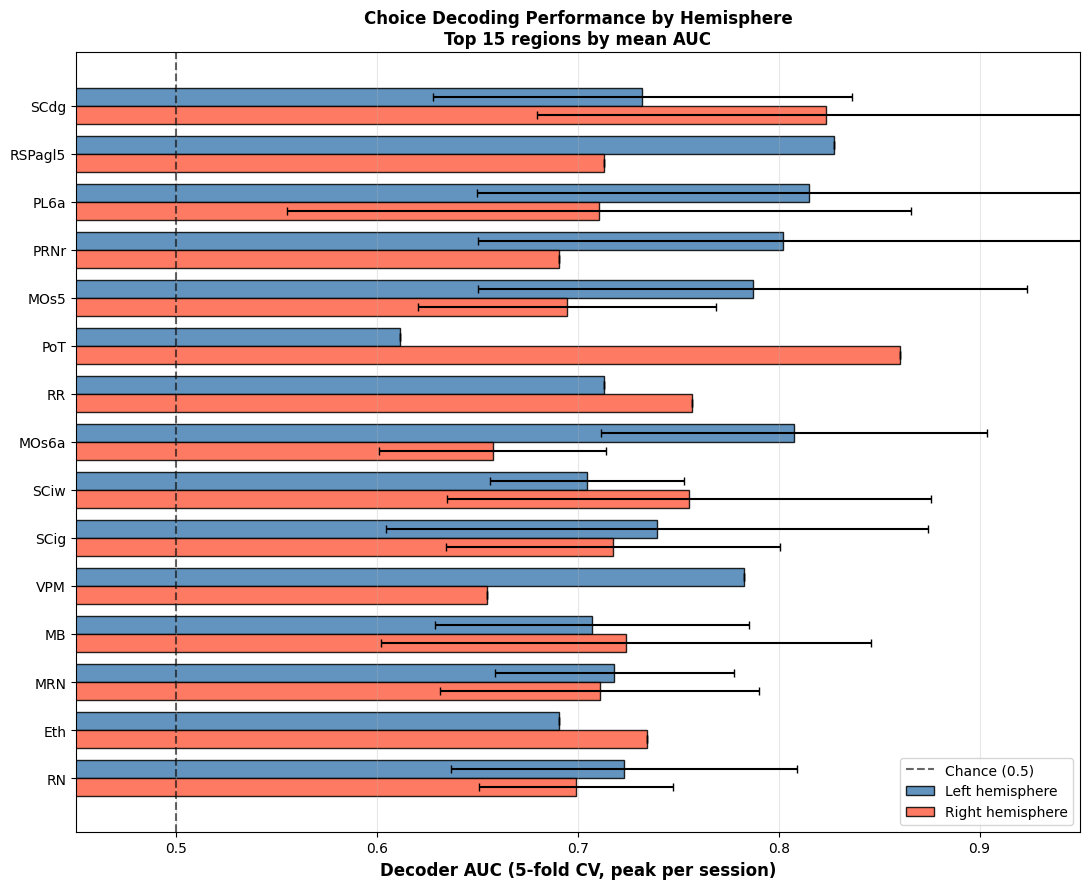
Top 15 regions ranked by mean decoder AUC, showing left and right hemisphere performance side-by-side. Top decoders (PL6a, MOs6a, SCdg, MOs5, MRN) overlap substantially with the top CCA choice encoders, validating that the dissociation between bilateral coupling and decision content is method-independent.

Supplementary 7:Top 15 regions ranked by mean decoder AUC, showing left and right hemisphere performance side-by-side. Top decoders (PL6a, MOs6a, SCdg, MOs5, MRN) overlap substantially with the top CCA choice encoders, validating that the dissociation between bilateral coupling and decision content is method-independent.