Bilateral hemispheric coupling is widespread but does not strictly predict choice encoding across the mouse brain
Abstract
Hemispheric interactions during cognition reflect the division and integration of neural resources required to transform perception into action. Using the IBL Brain-wide Map, comprising large-scale Neuropixels recordings from mice performing a visual decision-making task, we characterize interhemispheric coordination across 39 brain regions during choice behavior. Canonical Correlation Analysis (CCA) applied to bilateral recording sessions reveals that interhemispheric coupling is widespread (r = 0.25–0.96) but functionally not predictive of choice encoding: regions with the strongest bilateral synchrony do not necessarily represent the animal’s decision most strongly. Zero-lag dominance across regions indicates simultaneous rather than sequential bilateral coordination, though the underlying mechanism remains open. Our findings reveal distinct organizational principles governing interhemispheric coordination and decision-specific lateralization, and provide a reusable pipeline for characterizing bilateral neural dynamics across large-scale recording datasets.
Introduction
Rodent decision-making research has identified region-specific neural contributions: anterior cingulate cortex encodes cost-benefit analysis Hillman & Bilkey, 2010, ventral tegmental dopaminergic neurons signal reward magnitude and delay Roesch et al., 2007, and orbitofrontal cortex prepares expected outcome values for learning Miller et al., 2022 — a role subsequently confirmed in humans and macaques Noonan et al., 2017. Yet most rodent neuroscience observes the brain unilaterally, overlooking behaviorally relevant hemispheric asymmetries including limb preferences Manns et al., 2021 and anatomical volume asymmetries analogous to human cerebral petalia Silberfeld et al., 2025. Disregarding hemispheric interactions risks missing crucial asymmetries in neural processing that contribute to cognitive function and commissural organization Mundorf & Ocklenburg, 2025. New evidence further supports collecting bilateral recordings of brain activity as we now know that functional lateralization is not a fixed property but arises from learning-dependent synaptic plasticity producing asymmetric cross-hemispheric communication, as demonstrated by unilateral manipulation of the anterior lateral motor cortex during tactile decision-making in mice Ocklenburg & Guo, 2024Concha et al., 2012. The IBL Brain-wide Map — 699 Neuropixels insertions across 281 regions, of which 50 insertions across 39 regions were recorded homotopically — provides a uniquely suitable dataset for examining cross-hemispheric communication at scale during a visual decision-making task International Brain Laboratory, 2024International Brain Laboratory et al., 2025.
Methodology
Data and Preprocessing
To characterize bilateral population dynamics, we first reduced the high-dimensional neural recordings to a tractable low-dimensional representation. Electrophysiological recordings from N=152 bilateral region-pairs across 46 brain regions in mice performing a visual discrimination task were obtained from the International Brain Laboratory dataset International Brain Laboratory et al., 2025. All completed trials were included regardless of outcome, as our primary interest was in bilateral coordination during choice formation rather than accuracy-dependent processing. Regions corresponding to white matter tracts, ventricles, and mapping artifacts (void, root, fiber tracts) were excluded from analysis, yielding 39 brain regions. Spike times were binned at 25 ms resolution and smoothed with a Gaussian kernel (σ ≈ 37 ms, effective temporal resolution ~90 ms). Temporal analyses including cross-correlograms and peak latency estimates should be interpreted with this resolution constraint in mind. All spike-sorted units were included without additional quality filtering beyond the IBL Brainwidemap session-level quality control. Principal Component Analysis reduced population activity to K=3 components per hemisphere, capturing a median of 25.9% of total variance (IQR: 19.6–34.0%) across 614 region-hemisphere entries (median 42 neurons per entry, range 8–561). Sensitivity analysis with K=10 components yielded 20–40% variance for hippocampal and midbrain regions, confirming that these populations are intrinsically high-dimensional. PCA captures the axes of maximum variance, which in regions like the hippocampus are highly likely to reflect spatial and contextual rather than choice variables. Consequently, task-relevant communication may indeed sit in lower-variance components discarded by our K=3 cutoff Semedo et al., 2019 (Figure 1).
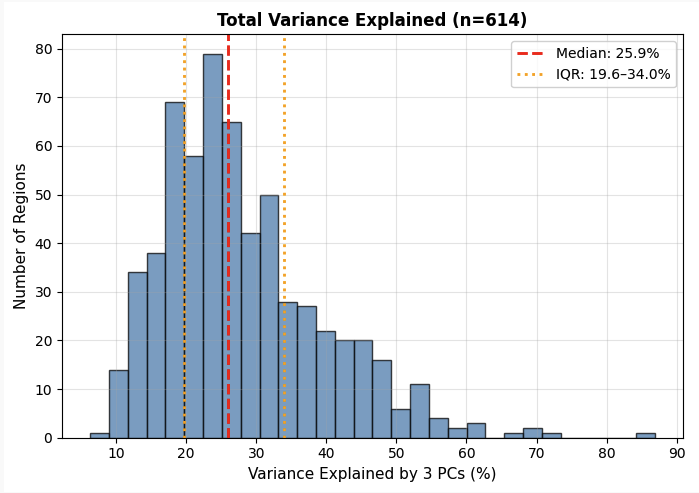
Figure 1:Total variance explained.
Temporal Canonical Correlation Analysis (CCA) with Cross-Validation
To quantify the strength of interhemispheric coordination at each moment in the trial, we applied CCA to the PCA-reduced bilateral representations. PCA scores were fitted on the full (trials × time) matrix, and the 80 time bins are the same 25 ms bins used for spike counting. Within-hemisphere decision encoding strength was quantified as the Fréchet distance between choice-averaged PCA trajectories (left-choice vs right-choice trials), providing a measure of trajectory separation in the low-dimensional neural manifold independent of bilateral coupling. For each time bin, we computed canonical variates via 3-fold cross-validation on trials. CCA finds the specific vectors a and b that maximize the normalized covariance (i.e., Pearson correlation) between left and right canonical variates across trials.
where , are the matrices of left- and right-hemisphere PCA scores at time bin (shape n_trials × 3; each row a trial, each column a PC), and , are the per-hemisphere weight vectors (shape 3). Peak bilateral coupling (r_peak) was identified as max(r_time) across all time bins. Reported r-values reflect test-fold estimates to guard against overfitting.
Significance Testing
To establish that observed coupling values reflect genuine interhemispheric coordination rather than chance co-variation, a permutation test was applied for each region. 500 permutations per region were generated by shuffling right-hemisphere trial order and recomputing CCA, with the 95th percentile of permuted r_peak values serving as the significance threshold. Cross-correlograms between U_time and V_time (lags ±500 ms) were assessed against null lag distributions (200 permutations), allowing us to evaluate whether the temporal structure of coupling, aside from its peak magnitude, exceeded chance. Benjamini-Hochberg FDR correction was applied across all 39 regions (α = 0.05); all r_peak values survived correction. Per-region p-values were computed using permutation testing with the Phipson & Smyth (2010) correction, and for multi-session regions, per-pair p-values were combined using Fisher’s method prior to FDR correction.
Temporal Dynamics and Hemispheric Asymmetry
Following the establishment of significance of the bilateral coupling, we aimed to characterise its evolution across the decision trial. Coupling strength was analyzed across three trial phases: pre-stimulus (−1000 to −500 ms), movement (−200 to +200 ms), and post-movement (+500 to +1000 ms) to examine how it varies across behaviorally distinct trial segments. Hemispheric asymmetry within each phase was quantified to assess the degree of divergence between hemispheres during each trial phase.
Choice Encoding Analysis
The next step was to examine for traces of decision-specific information in the bilateral coupling; therefore, we correlated each region’s canonical variates with the animal’s choice. Choice was normalized to ±1 and correlated with canonical variates at each time bin: bilateral choice encoding = (|r_choice_U(t)| + |r_choice_V(t)|) / 2. We extracted r_choice_peak, r_choice_mean, and peak_latency per region. Phase-specific choice encoding was computed for each trial phase. Spearman correlation tested whether bilateral coupling independently predicts choice encoding.
Choice Decoding Analysis
To verify that the symmetric bilateral encoding observed in the CCA analysis was not an artifact of CCA’s inherent symmetry constraint of finding the maximally correlated bilateral subspace, an independent population-level decoder (logistic regression with 5-fold cross-validation on the same PCA-reduced subspace) was trained per hemisphere across 614 (region, hemisphere, session) entries. This analysis was performed to estimate how well each hemisphere individually encodes the animal’s choice.
Statistical Reporting
Region-level summaries were computed across sessions using Fisher z-transformation of r values to aggregate coupling estimates reliably across sessions with varying trial counts. Confidence intervals were computed as tanh(z_mean ± 1.96×SE_z).
Software
The entire pipeline was implemented in Python 3.10; scikit-learn, numpy, scipy.stats, pandas. General-purpose large language models were used in this work for code assistance (error handling, optimising computation) and grammar checks. All code and reproducible outputs are available at https://
Results
Bilateral coupling is brain-wide but spatially heterogeneous
Temporal CCA, applied independently at each time bin with cross-validation, is robust to temporal misalignments from spike sorting and circuit-specific timescales, ensuring regional differences in coupling reflect genuine interhemispheric coordination rather than biophysical confounds. All 39 regions showed coupling above permutation null, ranging from r = 0.25 (VISpm2/3) to r = 0.96 (SUB) (Figure 2).
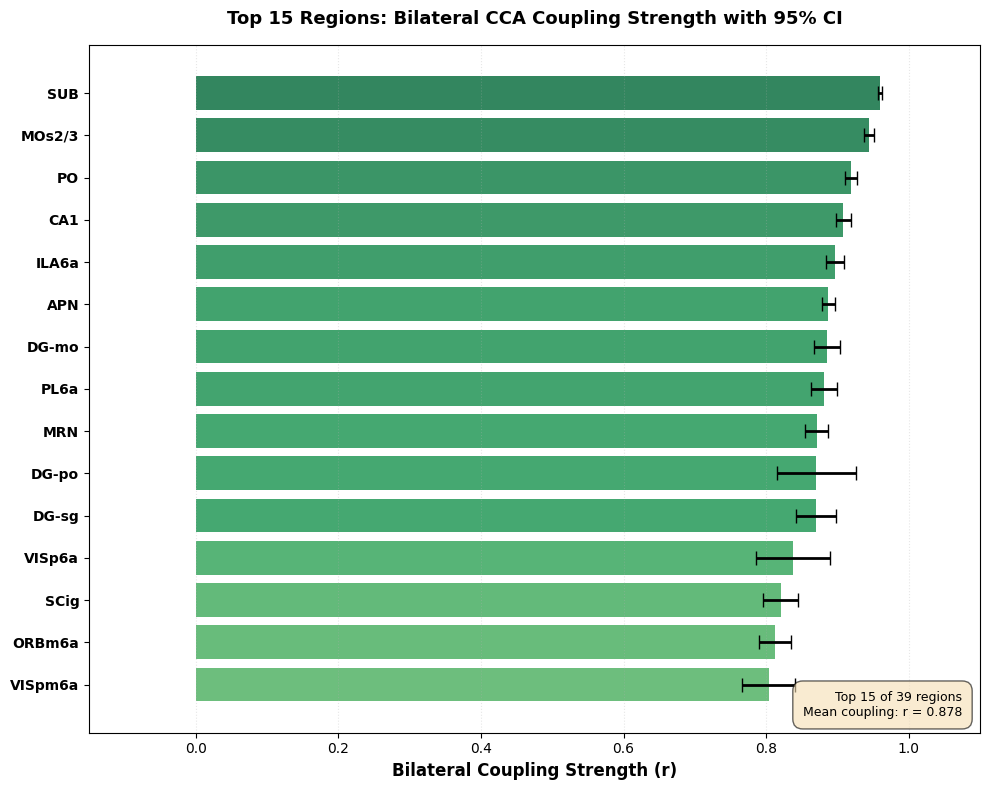
Figure 2:Top 15 brain regions ranked by bilateral coupling strength (peak r), with 95% confidence intervals. Error bars are bootstrap CIs computed from session-level r_peak values within each region. Mean coupling across the top 15 regions is r = 0.878. Subiculum (SUB) and primary motor cortex (MOs2/3) show the strongest bilateral coupling, while the ranking is dominated by hippocampal formation (SUB, CA1, DG-mo, DG-po, DG-sg) and prefrontal-thalamic structures (ILA6a, PL6a, PO, MRN).
Hippocampal formation (SUB: 0.96; CA1: 0.91; DG: 0.85–0.88) and midbrain nuclei (APN: 0.89; MRN: 0.87) showed the strongest coupling; higher visual areas the weakest (Supplementary 1). This heterogeneity argues against a single global synchronization mechanism and suggests an extension of the distributed coding framework Steinmetz et al., 2019 to the interhemispheric domain.
Coupling strength and choice encoding are organized by distinct spatial gradients
Peak coupling and peak choice encoding |r_choice| were uncorrelated across regions (Spearman ρ = −0.21, p = 0.17; Figure 3).
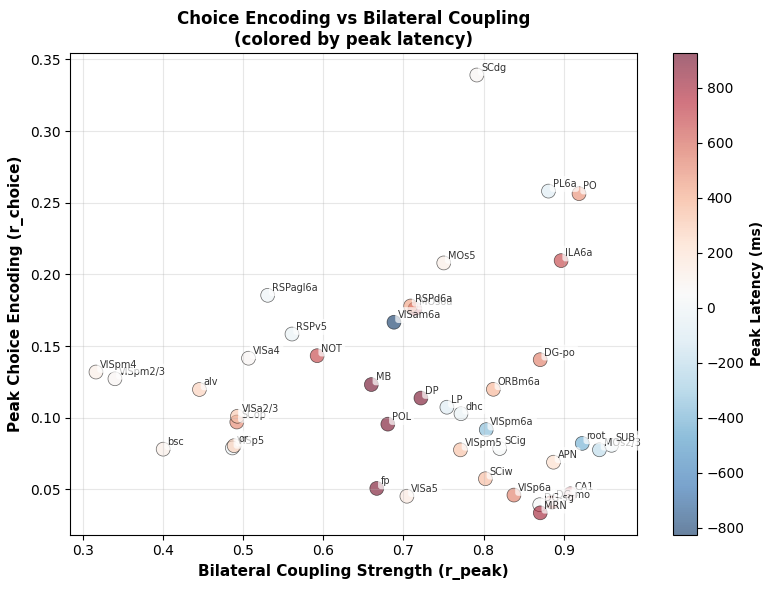
Figure 3:Choice encoding strength (peak r_choice) plotted against bilateral coupling strength (r_peak) for each brain region, colored by peak choice-encoding latency relative to movement onset (blue = pre-movement, red = post-movement). The lack of correlation between the two axes (Spearman ρ = −0.21, p = 0.17) demonstrates the spatial dissociation: regions with the highest bilateral coupling are not the strongest choice encoders, and vice versa. Latency coloring further reveals temporal heterogeneity — pre-movement encoders (PL6a, SCdg) cluster separately from post-movement encoders (PO, ILA6a, RSPd6a).
Hippocampal regions had the highest coupling but the lowest decision fraction — the proportion of bilateral coupling devoted to choice encoding, defined as |r_choice| / r_peak — (CA1: 0.04; SUB: 0.06), meaning less than 6% of their bilateral synchrony related to the animal’s upcoming choice. In contrast, prelimbic and infralimbic cortex had moderate coupling with the highest decision fraction (PL6a: 0.22; ILA6a: 0.20), indicating that over a fifth of their interhemispheric coordination specifically carried decision information. No region showed FDR-significant choice encoding in the bilateral subspace, consistent with the interpretation that choice information is not preferentially routed through the maximally coupled bilateral channel.
The Swanson flatmap visualizes this dissociation (Figure 4): coupling is dominated by hippocampal and midbrain structures, while choice encoding concentrates in prefrontal and posterior thalamic regions, paralleling the selective communication subspace of Semedo et al. (2019) extended to the bilateral context.
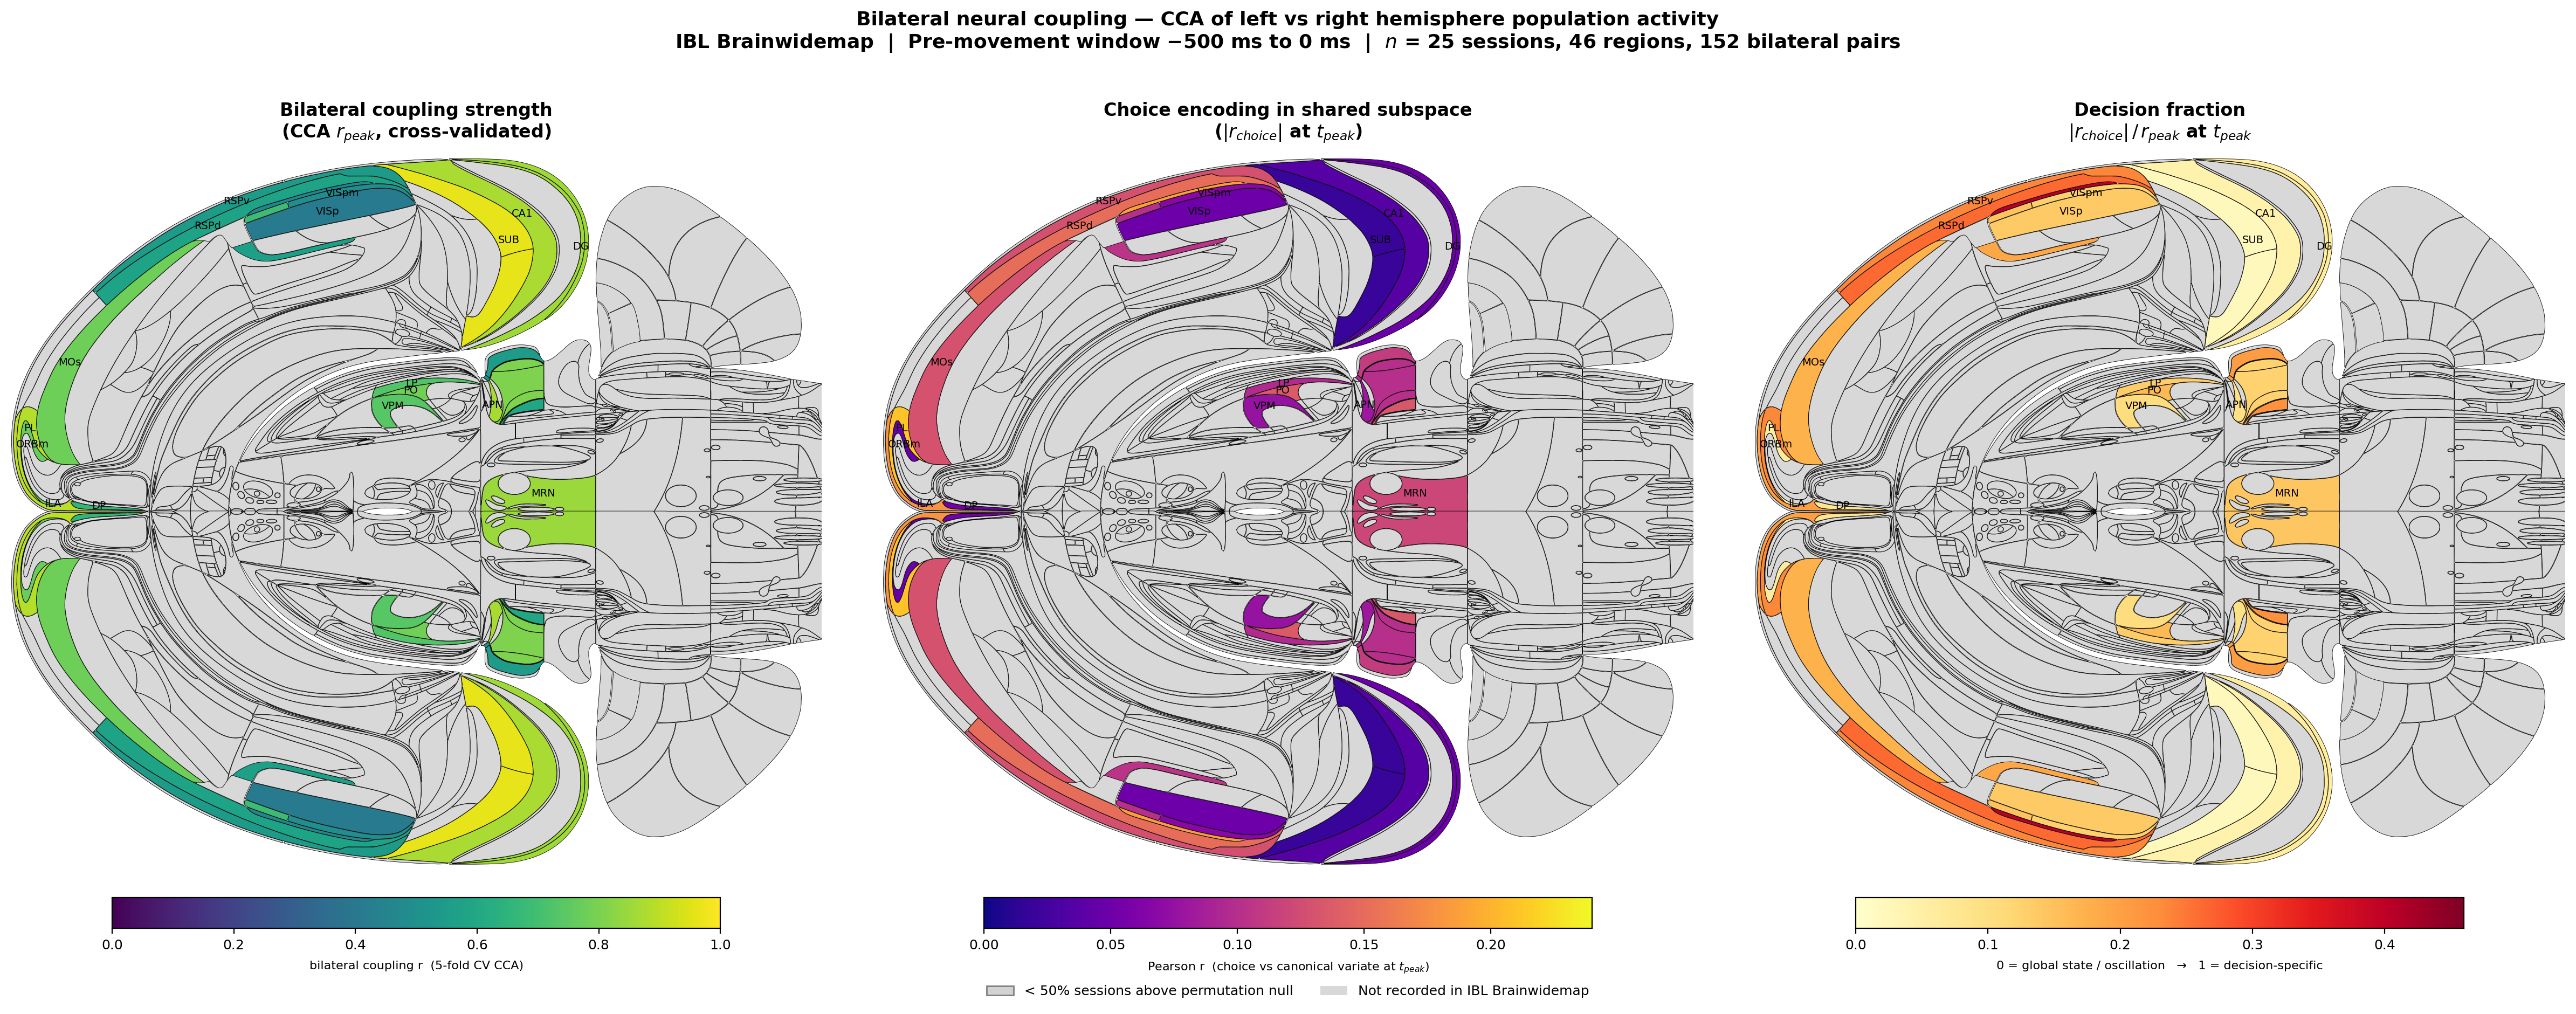
Figure 4:Three-panel Swanson flatmap projection of CCA bilateral coupling metrics across 27 brain regions (39 fine-grained Allen acronyms aggregated to Swanson-level parents).
Left: bilateral coupling strength (cross-validated CCA r_peak) — strongest in hippocampal formation and midbrain.
Middle: choice encoding in the bilateral subspace (|r_choice| at t_peak) — concentrated in prefrontal cortex (PL, ILA), posterior thalamus (PO), and deep superior colliculus.
Right: decision fraction (|r_choice| / r_peak; thresholded at r_peak ≥ 0.5) — quantifies what proportion of bilateral coupling is decision-specific, revealing the spatial dissociation between coupling strength and choice content.
Choice encoding strength varied widely across regions
The strongest encoders were SCdg (r_choice = 0.34, +75 ms), PL6a (0.26, −75 ms), and PO (0.26, +475 ms) (Figure 5). PL6a’s pre-movement timing supports motor planning; PO and ILA6a peaked post-movement.
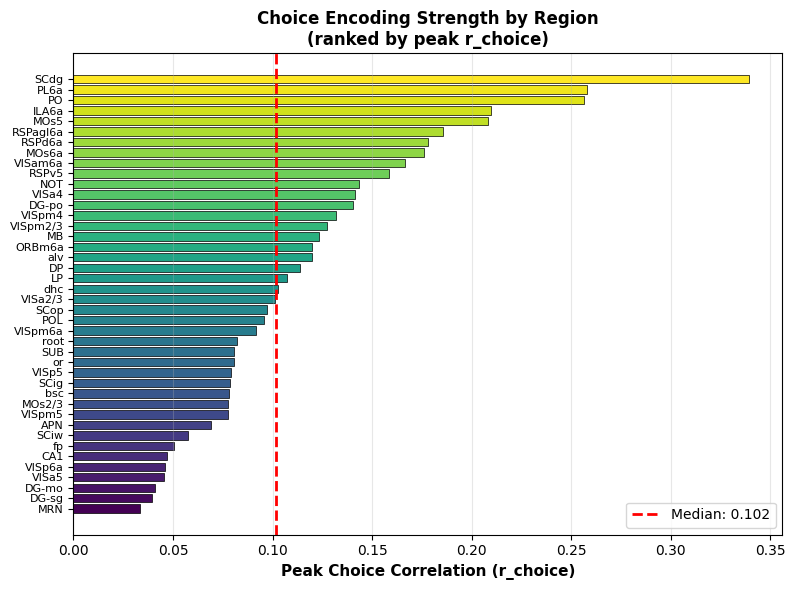
Figure 5:Choice encoding strength (peak r_choice) ranked across all 39 brain regions. Bars show the maximum bilateral choice correlation for each region, with the dashed red line marking the population median (0.102). Colors reflect rank order.
Bilateral coupling was sustained across the trial in motor, hippocampal, and midbrain regions, with phase-dependent modulation in visual and thalamic regions (Figure 6).
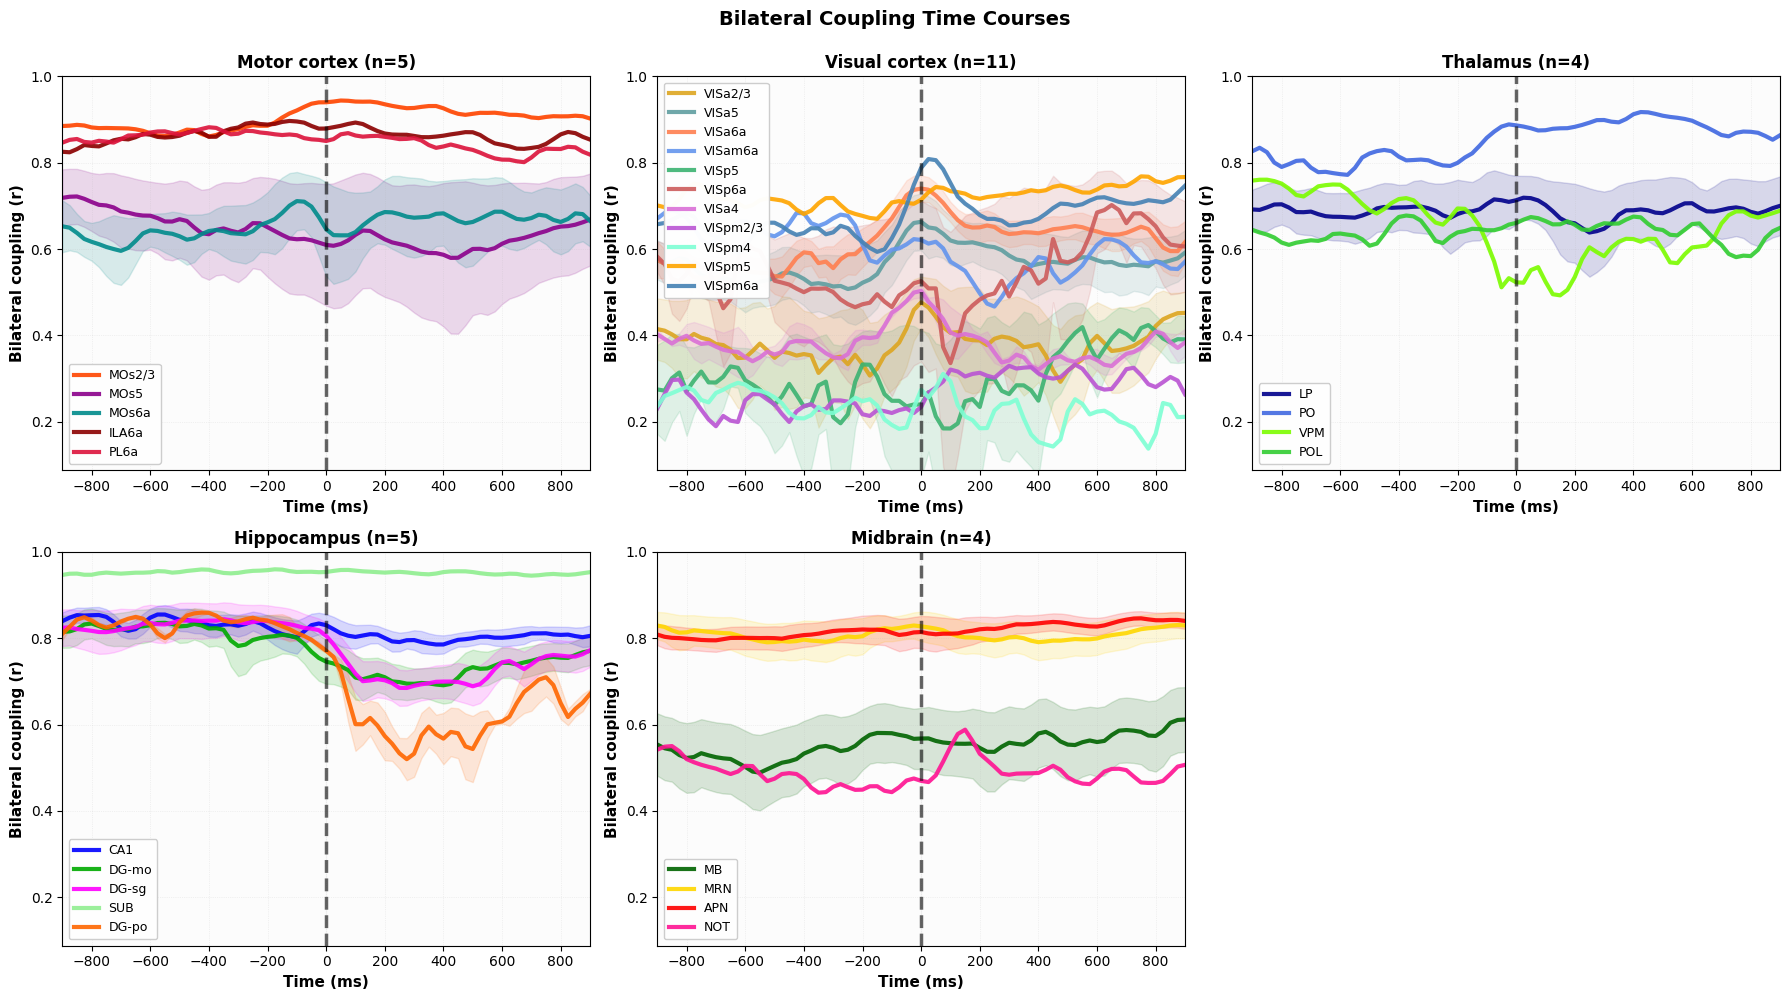
Figure 6:Bilateral coupling strength r(t) over time, grouped by anatomical system (motor, visual, thalamus, hippocampus, midbrain; n = number of sessions per group). Each line shows the time-resolved cross-validated CCA coupling for one region within the group. The vertical dashed line marks movement onset (t = 0). Hippocampal and midbrain regions show sustained high coupling throughout the trial, while motor, visual, and thalamic regions exhibit phase-dependent modulation around movement onset.
Three temporal profiles identified in bilateral coupling cross-correlograms
Cross-correlograms (±500 ms, 25 ms resolution) revealed zero-lag dominance across the majority of regions (Figure 7). Three exploratory profiles emerged: oscillatory zero-lag coupling with theta-period flanking in hippocampal and midbrain regions; broad sustained zero-lag coupling in prefrontal and collicular regions; and asymmetric positive-lag profiles in retrosplenial and posterior thalamic regions. The oscillatory flanking in the cross-correlogram is consistent with theta-band periodicity, but was not formally tested with spectral analysis. While our data establish macro-scale simultaneity, they cannot definitively distinguish between common-input drive, fast transcallosal loops, or shared state-dependent drifts such as arousal level or large-scale neuromodulation. Though not individually significant after permutation correction, their anatomical specificity points to mechanistically distinct bilateral coordination strategies across the brain’s functional hierarchy.
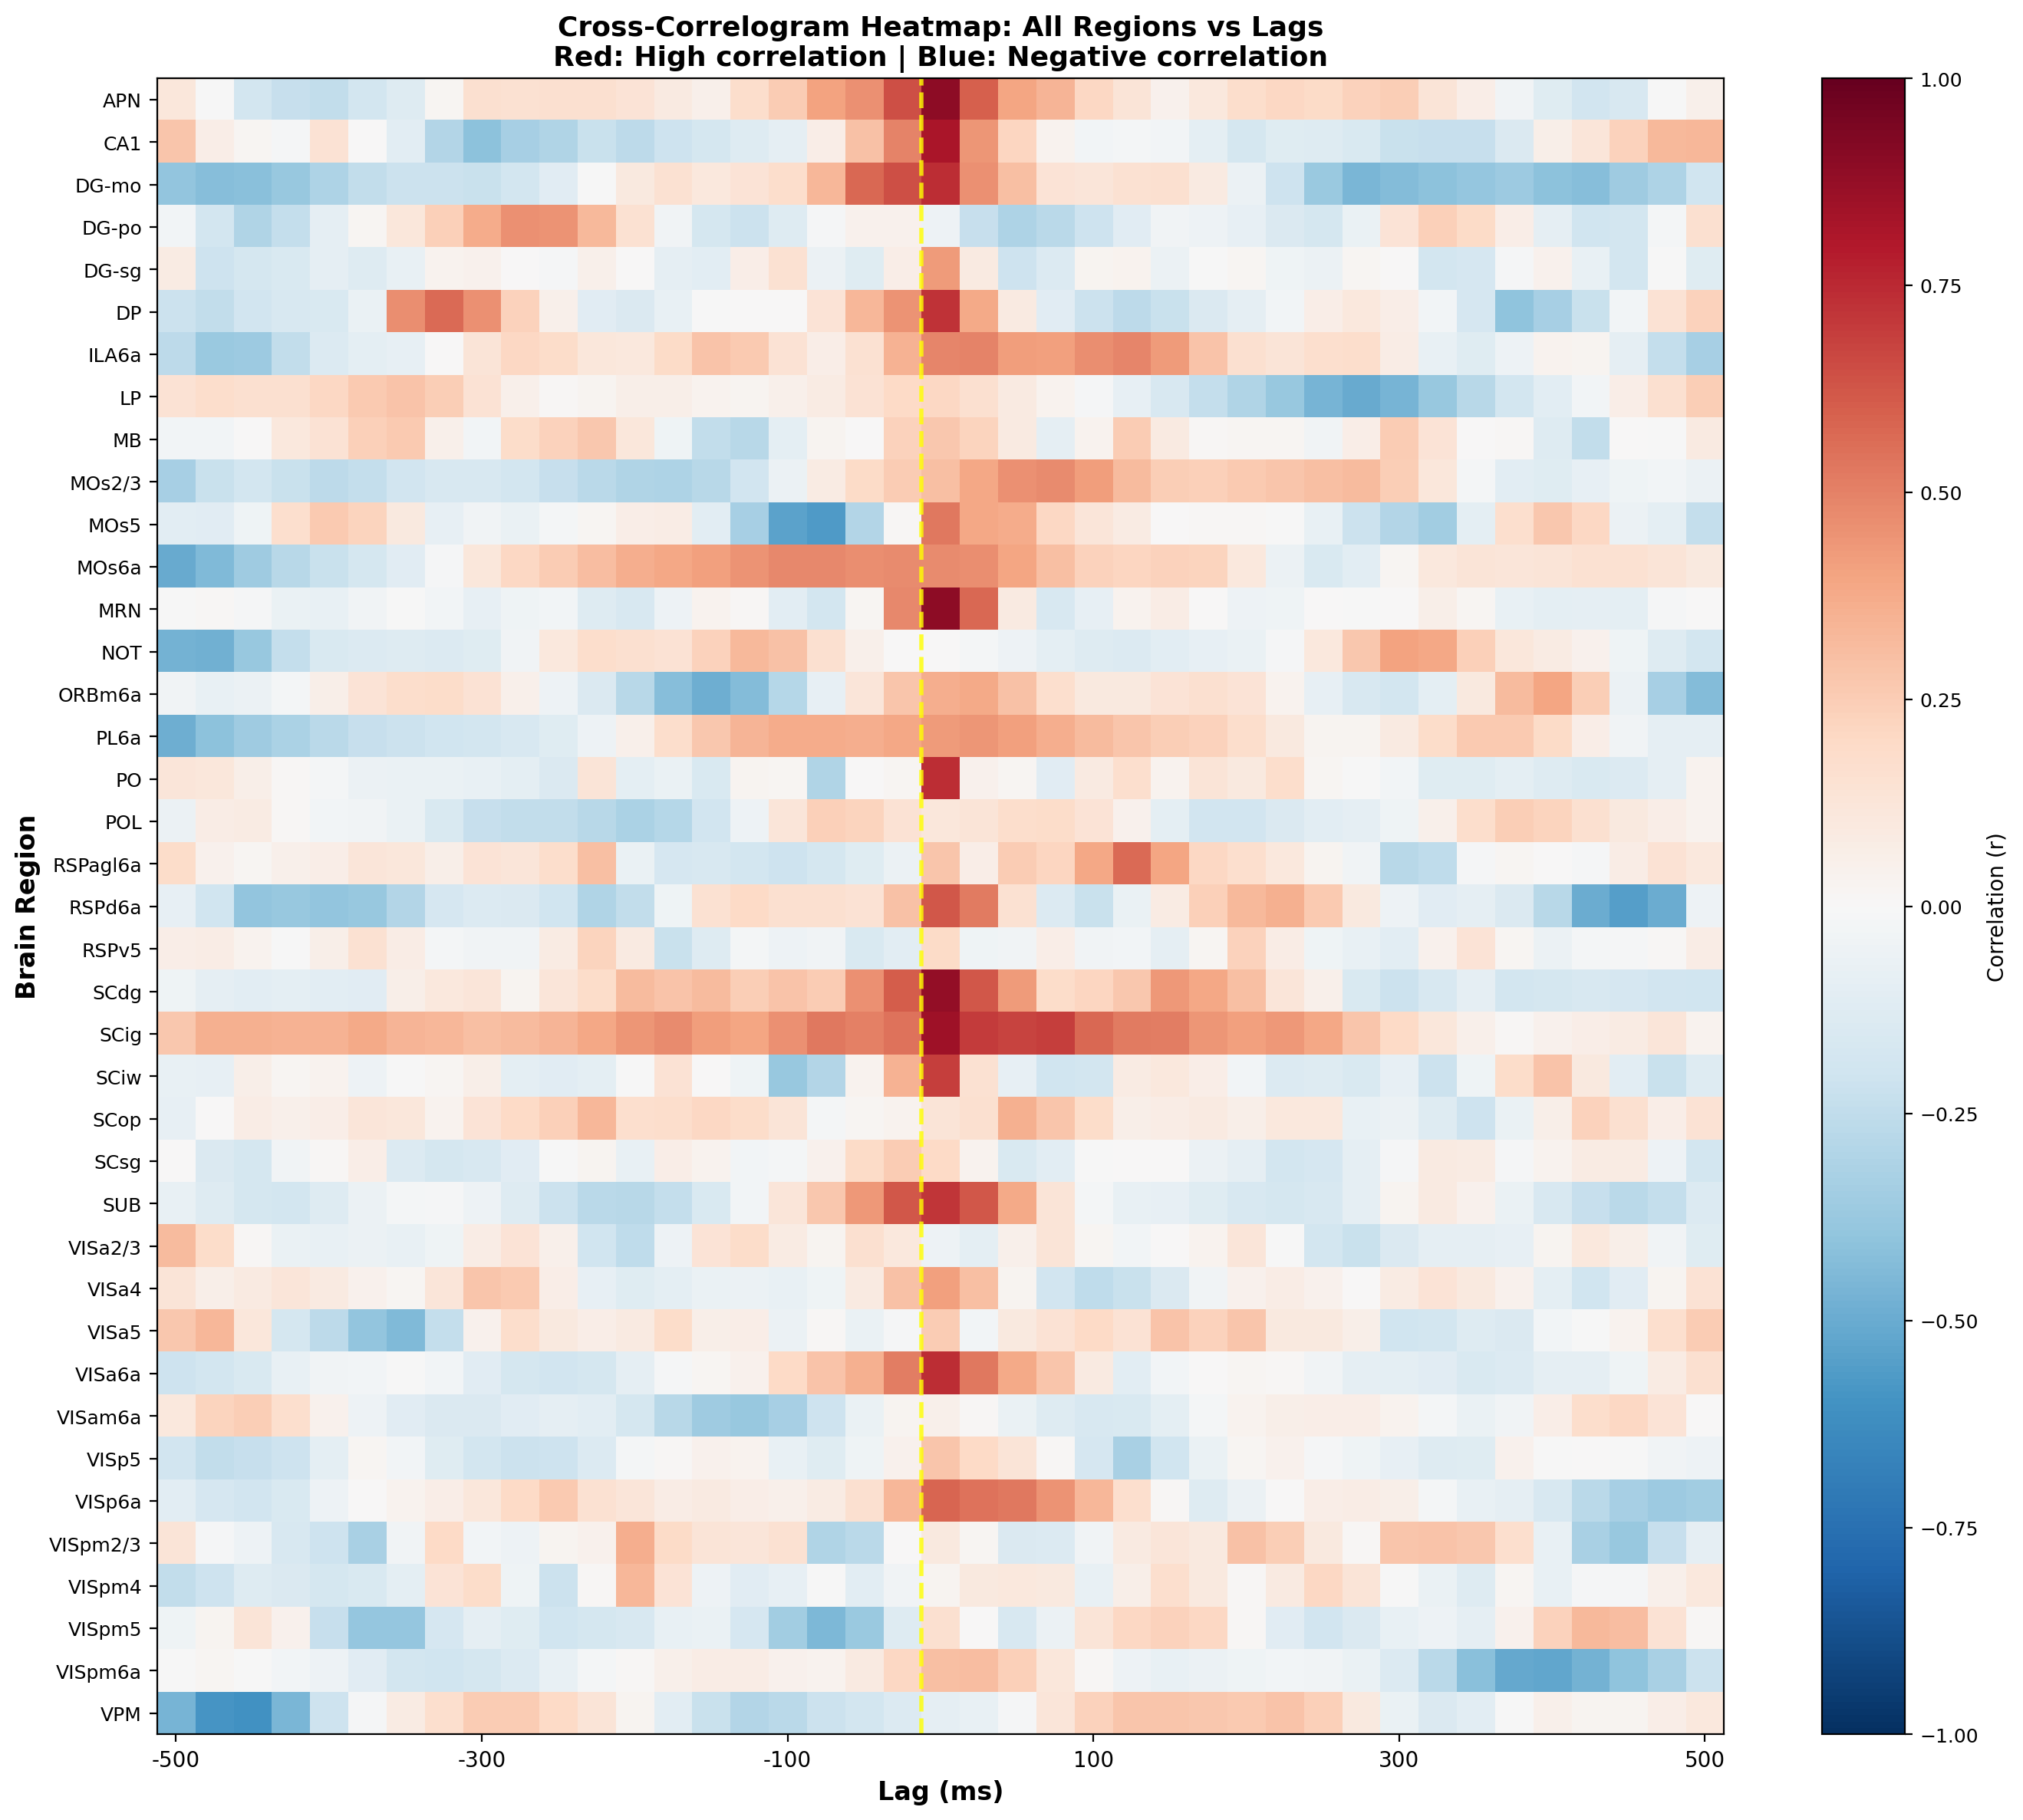
Figure 7:Cross-correlogram heatmap of bilateral canonical variates across all regions. For each region, trial-averaged U(t) (left hemisphere) and V(t) (right hemisphere) from CCA. The yellow dashed line marks zero lag; negative lags indicate left-hemisphere lead, positive lags indicate right-hemisphere lead. Red and blue indicate positive and negative correlations, respectively, revealing distinct temporal coupling structures across the brain — sharp zero-lag peaks with oscillatory flanking in hippocampal and midbrain regions, broad sustained coupling in collicular and prefrontal regions, and asymmetric lag profiles in select association areas.
Discussion
The central finding of this study is not that bilateral coupling fails to predict choice encoding, but that the two properties are organized by distinct anatomical principles. Hippocampal regions present a particularly informative case: despite showing the strongest bilateral coupling (SUB: 0.96; CA1: 0.91), their decision fraction was the lowest observed (CA1: 0.04; SUB: 0.06), yet the independent decoder confirmed that each hemisphere individually encodes choice at above-chance levels (CA1: 0.65; SUB: 0.66), revealing that choice information exists within each hemisphere but is not routed through the bilateral channel. The finding that the SUB can encode choice unilaterally and show near-perfect bilateral coupling, but have a negligible decision fraction, can be explained by the orthogonality of these neural subspaces. CCA isolates the specific neural space/manifold that maximizes variance shared across hemispheres. In a region like the hippocampal formation, this shared variance is dominated by symmetric, state-dependent variables, and not decision variables. Interhemispheric coordination in hippocampal regions likely reflects shared contextual and spatial state variables rather than decision-specific information transfer. The temporal profiles identified through bilateral coupling cross-correlograms must be treated as exploratory observations that can inform about distinct bilateral coordination strategies across the brain’s functional hierarchy. The organizational principle identified here, integration for motor output and segregation for sensory analysis, parallels hemispheric specialization observed across vertebrates and may reflect a conserved feature of bilateral brain organization. Clinically, the regional specificity of bilateral coupling offers a framework for predicting consequences of interhemispheric disconnection, with motor and hippocampal regions expected to be most vulnerable to callosal disruption. The CCA pipeline developed here provides a reusable tool for characterizing bilateral neural dynamics across large-scale datasets, with natural extension to machine-learning inference of contralateral dynamics from unilateral recordings.
Limitations
Our study has several limitations. The IBL Brainwidemap dataset is dominated by unilateral recordings, which restricted the sample size of bilateral pairs. Cell-type information was unavailable, preventing us from distinguishing excitatory, inhibitory, and interneuronal contributions to bilateral coupling and inflating within-region signal variability. CCA itself imposes constraints: by extracting only the maximally correlated bilateral subspace, it captures a small fraction of total population activity, and additional decision-related communication may exist in lower-ranked canonical dimensions not analysed here. All results are correlational and cannot establish causality.
Future Directions
Given the wealth of unilateral data and the restrictions in obtaining bilateral recordings, machine-learning frameworks are being developed to infer contralateral dynamics from recorded hemispheres. Applied to IBL’s large-scale left-hemisphere data, such models could probe bilateral dynamics at greater scale. Optogenetic unilateral silencing of top choice-encoding regions would test whether bilateral coupling is causally necessary for coordinated choice. Cross-region bilateral CCA (e.g., left motor cortex vs right hippocampus) could reveal inter-area bilateral coordination channels. Linking coupling strength to behavioral outcomes (accuracy, stimulus contrast) would clarify its functional relevance. Decoding-based extensions, replacing Pearson correlation with classifiers trained jointly on canonical variates, would more precisely resolve when decision information emerges in the bilateral subspace. Together, these directions would move the field from characterizing interhemispheric coordination to testing its computational necessity.
Acknowledgments
We extend our sincere thanks to the Neuromatch Academy and the Impact Scholars program for the opportunity, resources and funding to develop this work. We will fondly remember our mentor, Nader Nikbakht, for his unwavering guidance, constructive feedback, great humor and fascinating insights into the world of systems neuroscience. Thank you for sharing your passion and allowing ours to grow. We promise to cherish and carry forward the mentorship you offered as we grow with this field.
Data Availability
Published via Impact Scholars; original development repository.
- Hillman, K. L., & Bilkey, D. K. (2010). Neurons in the rat anterior cingulate cortex dynamically encode cost–benefit in a spatial decision-making task. Journal of Neuroscience, 30(22), 7705–7713.
- Roesch, M. R., Calu, D. J., & Schoenbaum, G. (2007). Dopamine neurons encode the better option in rats deciding between differently delayed or sized rewards. Nature Neuroscience, 10(12), 1615–1624.
- Miller, K. J., Botvinick, M. M., & Brody, C. D. (2022). Value representations in the rodent orbitofrontal cortex drive learning, not choice. Elife, 11, e64575.
- Noonan, M. P., Chau, B. K., Rushworth, M. F., & Fellows, L. K. (2017). Contrasting effects of medial and lateral orbitofrontal cortex lesions on credit assignment and decision-making in humans. Journal of Neuroscience, 37(29), 7023–7035.
- Manns, M., El Basbasse, Y., Freund, N., & Ocklenburg, S. (2021). Paw preferences in mice and rats: Meta-analysis. Neuroscience & Biobehavioral Reviews, 127, 593–606.
- Silberfeld, A., Roe, J. M., Ellegood, J., Lerch, J. P., Qiu, L., Kim, Y., Lee, J. G., Hopkins, W. D., Grandjean, J., Ou, Y., & others. (2025). Left-right brain-wide asymmetry of neuroanatomy in the mouse brain. NeuroImage, 307, 121017.
- Mundorf, A., & Ocklenburg, S. (2025). Looking at Both Sides: Integrating Data From Both Hemispheres Is Crucial in Rodent Neuroscience. European Journal of Neuroscience, 62(5), e70249.
- Ocklenburg, S., & Guo, Z. V. (2024). Cross-hemispheric communication: Insights on lateralized brain functions. Neuron, 112(8), 1222–1234.
- Concha, M. L., Bianco, I. H., & Wilson, S. W. (2012). Encoding asymmetry within neural circuits. Nature Reviews Neuroscience, 13(12), 832–843.
- International Brain Laboratory. (2024). Data release - Brainwide map - Q4 2022. 10.6084/M9.FIGSHARE.21400815.V7
- International Brain Laboratory, Angelaki, D., Benson, B., Benson, J., Birman, D., Bonacchi, N., Bougrova, K., Bruijns, S. A., Carandini, M., Catarino, J. A., & others. (2025). A brain-wide map of neural activity during complex behaviour. Nature, 645(8079), 177–191.
- Semedo, J. D., Zandvakili, A., Machens, C. K., Yu, B. M., & Kohn, A. (2019). Cortical areas interact through a communication subspace. Neuron, 102(1), 249–259.
- Phipson, B., & Smyth, G. K. (2010). Permutation P-values should never be zero: calculating exact P-values when permutations are randomly drawn. Statistical Applications in Genetics and Molecular Biology, 9(1).
- Steinmetz, N. A., Zatka-Haas, P., Carandini, M., & Harris, K. D. (2019). Distributed coding of choice, action and engagement across the mouse brain. Nature, 576(7786), 266–273. 10.1038/s41586-019-1787-x